Ripple Price Prediction – March 7
The Ripple price prediction shows that XRP is slightly ranging as the market continues to respect the $0.70 support.
XRP/USD Market
Key Levels:
Resistance levels: $0.90, $0.95, $1.00
Support levels: $0.60, $0.55, $0.50
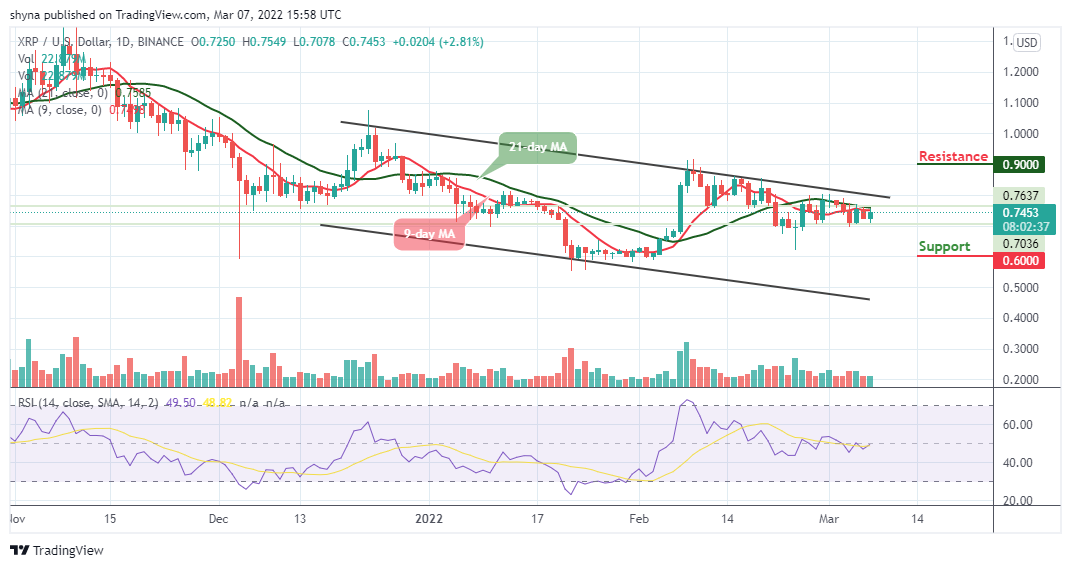
XRP/USD is trading sideways, gaining around 2.81% during the negotiation today. Looking at the daily chart, the Ripple has been moving sideways for the past few days. Now, the bulls are trying to come back into the market with a cross above the 9-day and 21-day moving averages, which may head towards the resistance level of $0.80.
Ripple Price Prediction: Would Ripple Price Cross Above the Moving Averages?
The Ripple price is consolidating within the market at the time of writing and the coin has seen a slight increase in the market as it is currently trading around $0.74. In the meantime, XRP/USD may continue to a sideways movement before any breakout or breakdown of the channel.
Moreover, should in case the price breaks above the upper boundary of the channel, the resistance levels of $0.90, $0.95, and $1.00 could be visited. Meanwhile, for a backward movement, the market can be supported at $0.60 and $0.55, and should the price falls below the previous levels, another support is around $0.50 while the Relative Strength Index (14) is moving below the 50-level.
When compared with Bitcoin, the Ripple price is currently changing hands at 1900 SAT, and it’s trading above the 9-day and 21-day moving averages. Therefore, if the above-mentioned level can serve as the market support, the Ripple price may likely face the key resistance at 2100 SAT. By reaching this level, XRP/BTC could cross above the upper boundary of the channel to hit the resistance level of 2200 SAT and above.
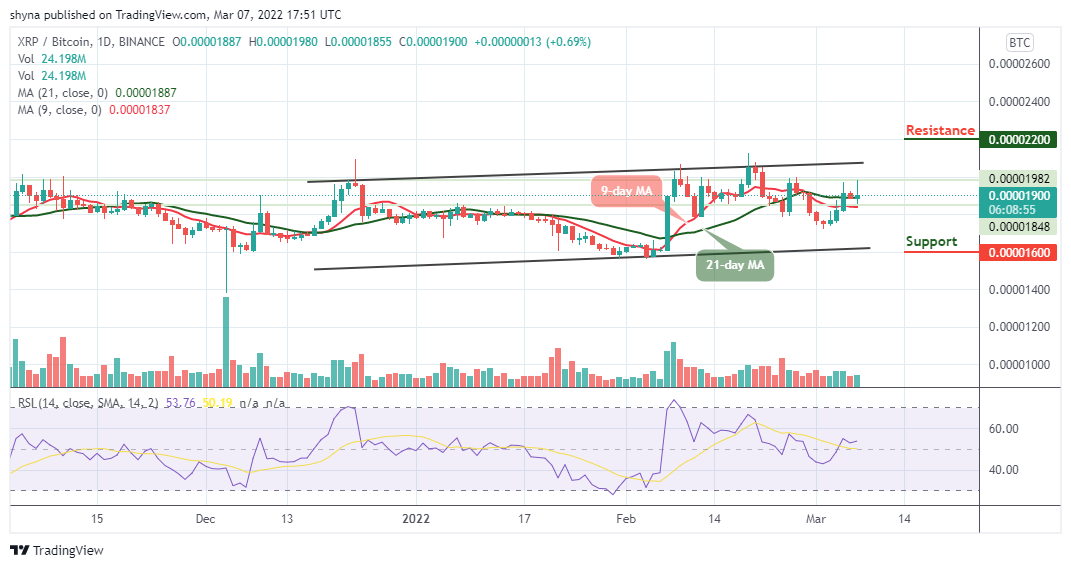
However, if the bulls fail to keep the price above the moving averages, the market may begin its downtrend and the coin could probably record further declines below the lower boundary of the channel. Breaking this barrier could take the market to the nearest support level of 1600 SAT and below while the signal line of the Relative Strength Index (14) moves in the same direction above the 50-level.
Looking to buy or trade Ripple (XRP) now? Invest at eToro!
68% of retail investor accounts lose money when trading CFDs with this provider


