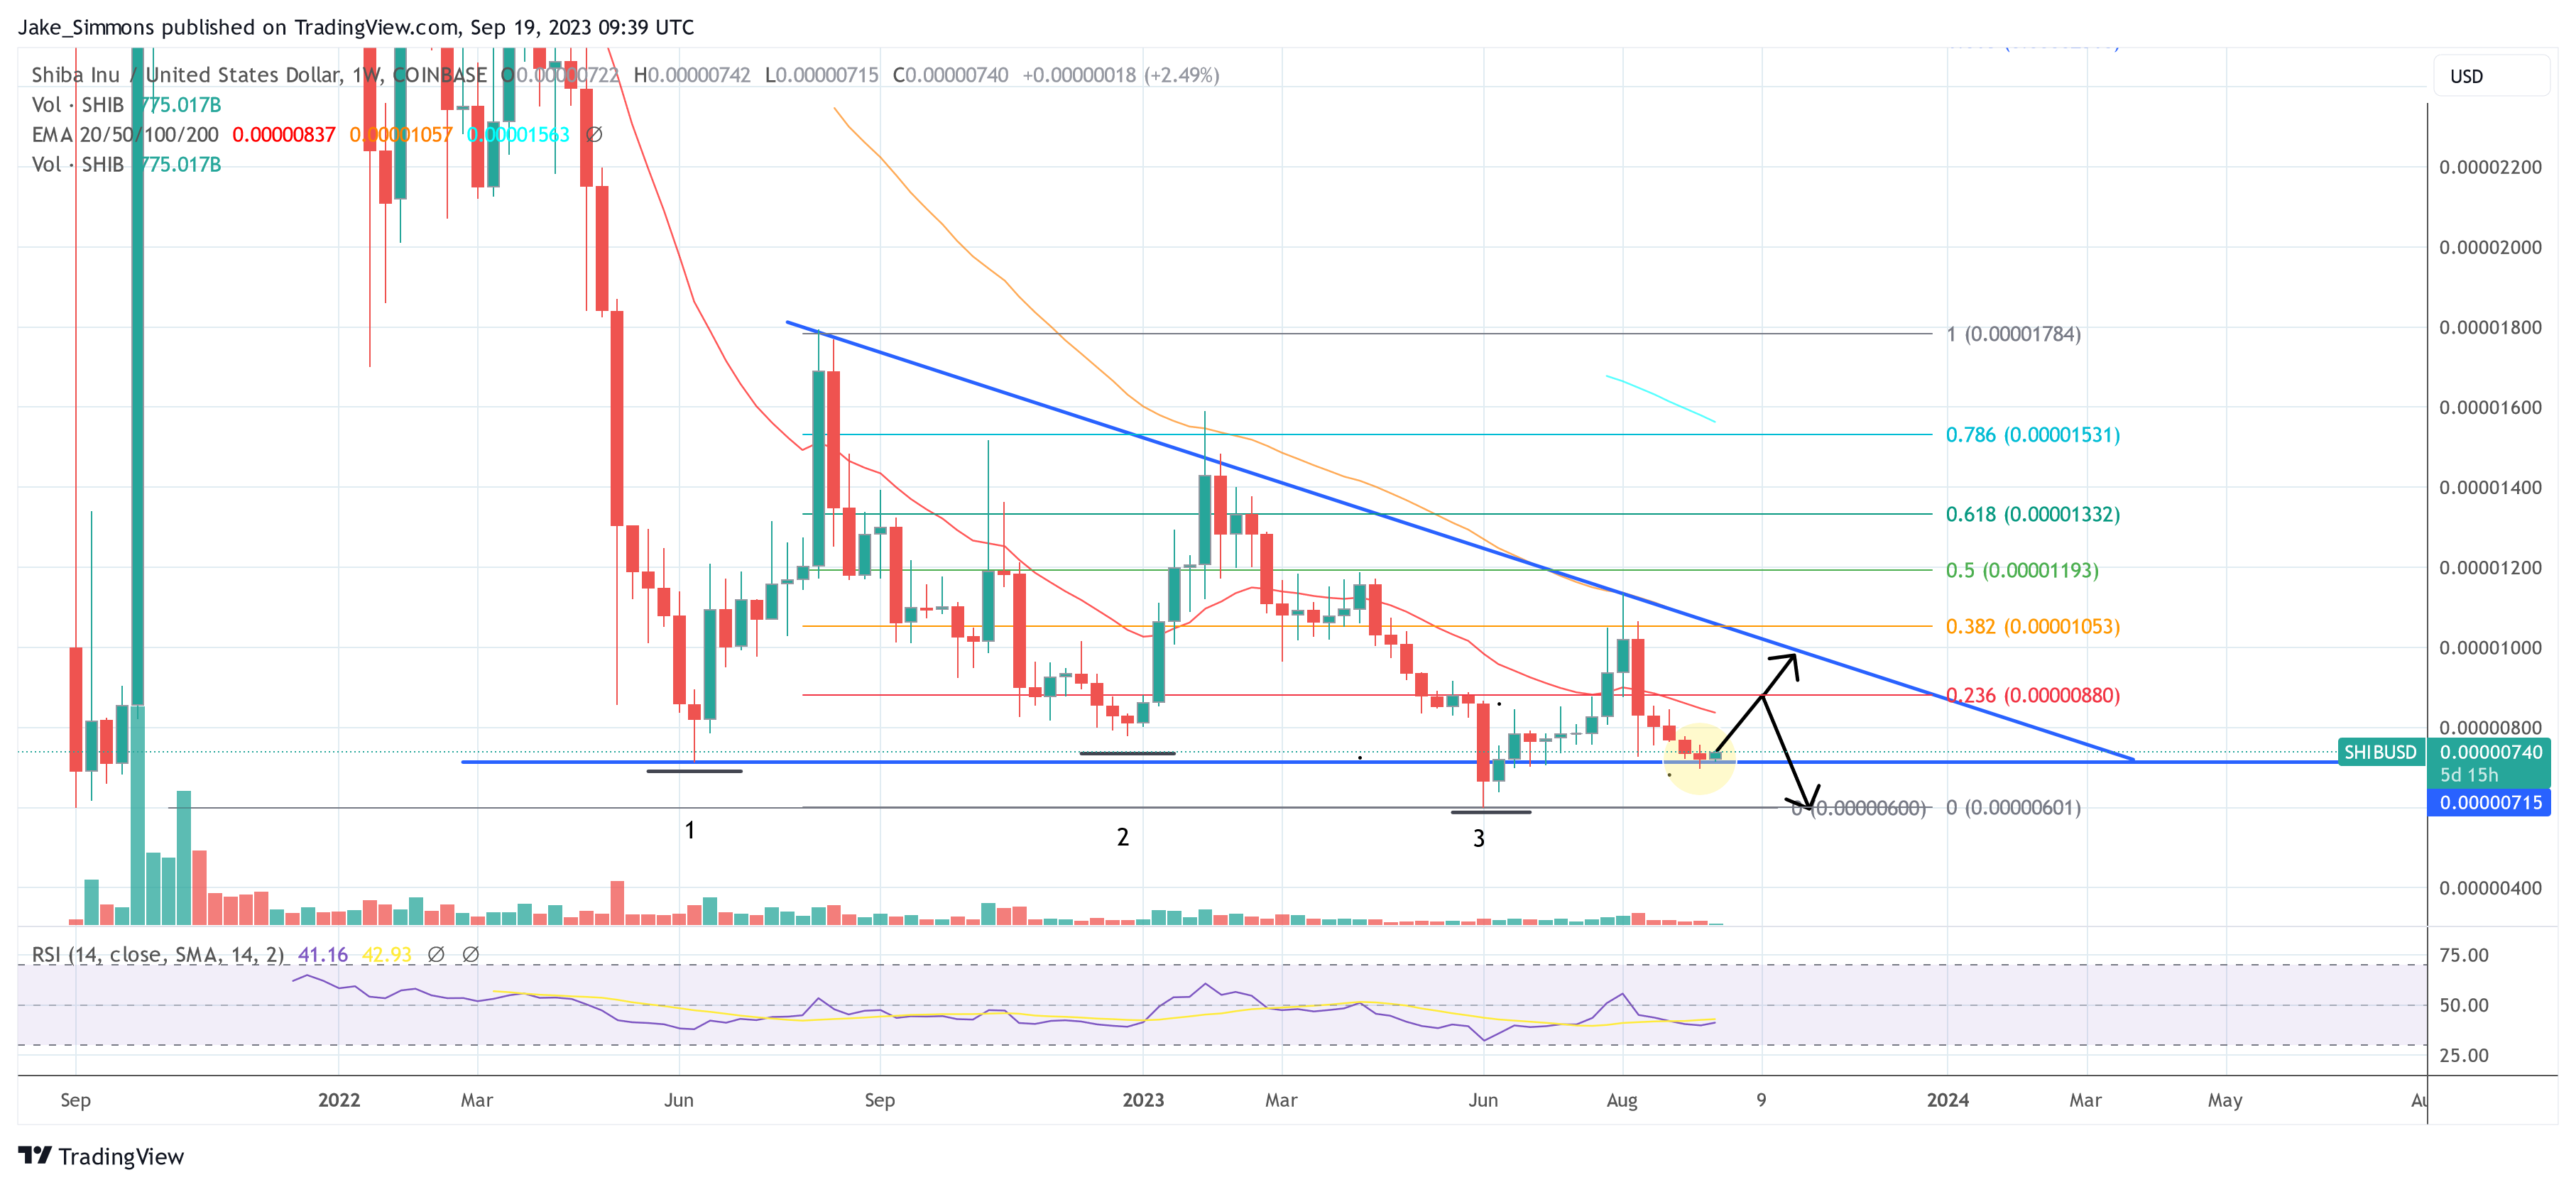
Shiba Inu (SHIB) continues to be in a pivotal make-or-break moment. As described in our last in-depth price analysis of SHIB, two chart patterns on the 1-week chart could continue to determine the future of SHIB price, and their outlooks could not be more different.
We are talking about a bullish triple bottom that points to a possible end of SHIB’s two-year downtrend and a descending triangle that has been formed for over 13 months, indicating a bearish trend.
Shiba Inu Price Analysis: Update
At the moment, the bulls seem to have the upper hand. SHIB was trading at $0.00000741 at press time and managed a weekly close above the crucial support line of $0.00000715 on Sunday evening. With this, SHIB may have fended off the bears’ attack for now and is targeting a rise towards the descending triangle resistance line.
The possibility of a validation of the triple bottom, a bullish chart pattern, thus remains. The chart pattern is characterized by three lows at roughly the same level, bouncing off a support level and culminating in a breakout above resistance.
However, the bulls remain vulnerable. If the SHIB price falls below the $0.00000715 support level, it could confirm the descending triangle and potentially push SHIB towards its year-to-date low of $0.000006. A break of this level could plunge SHIB into uncharted waters and make a new all-time low a grim possibility.
On the way up, key resistances include $0.00000880 (23.6% Fibonacci), the descending triangle trendline at around $0.0000095 and $0.00001, $0.00001053 (38.6% Fibonacci), $0.00001193 (50% Fibonacci), and $0.00001332 (61.8% Fibonacci). As then, the August 2022 high at $0.00001784 could be extremely important resistance.
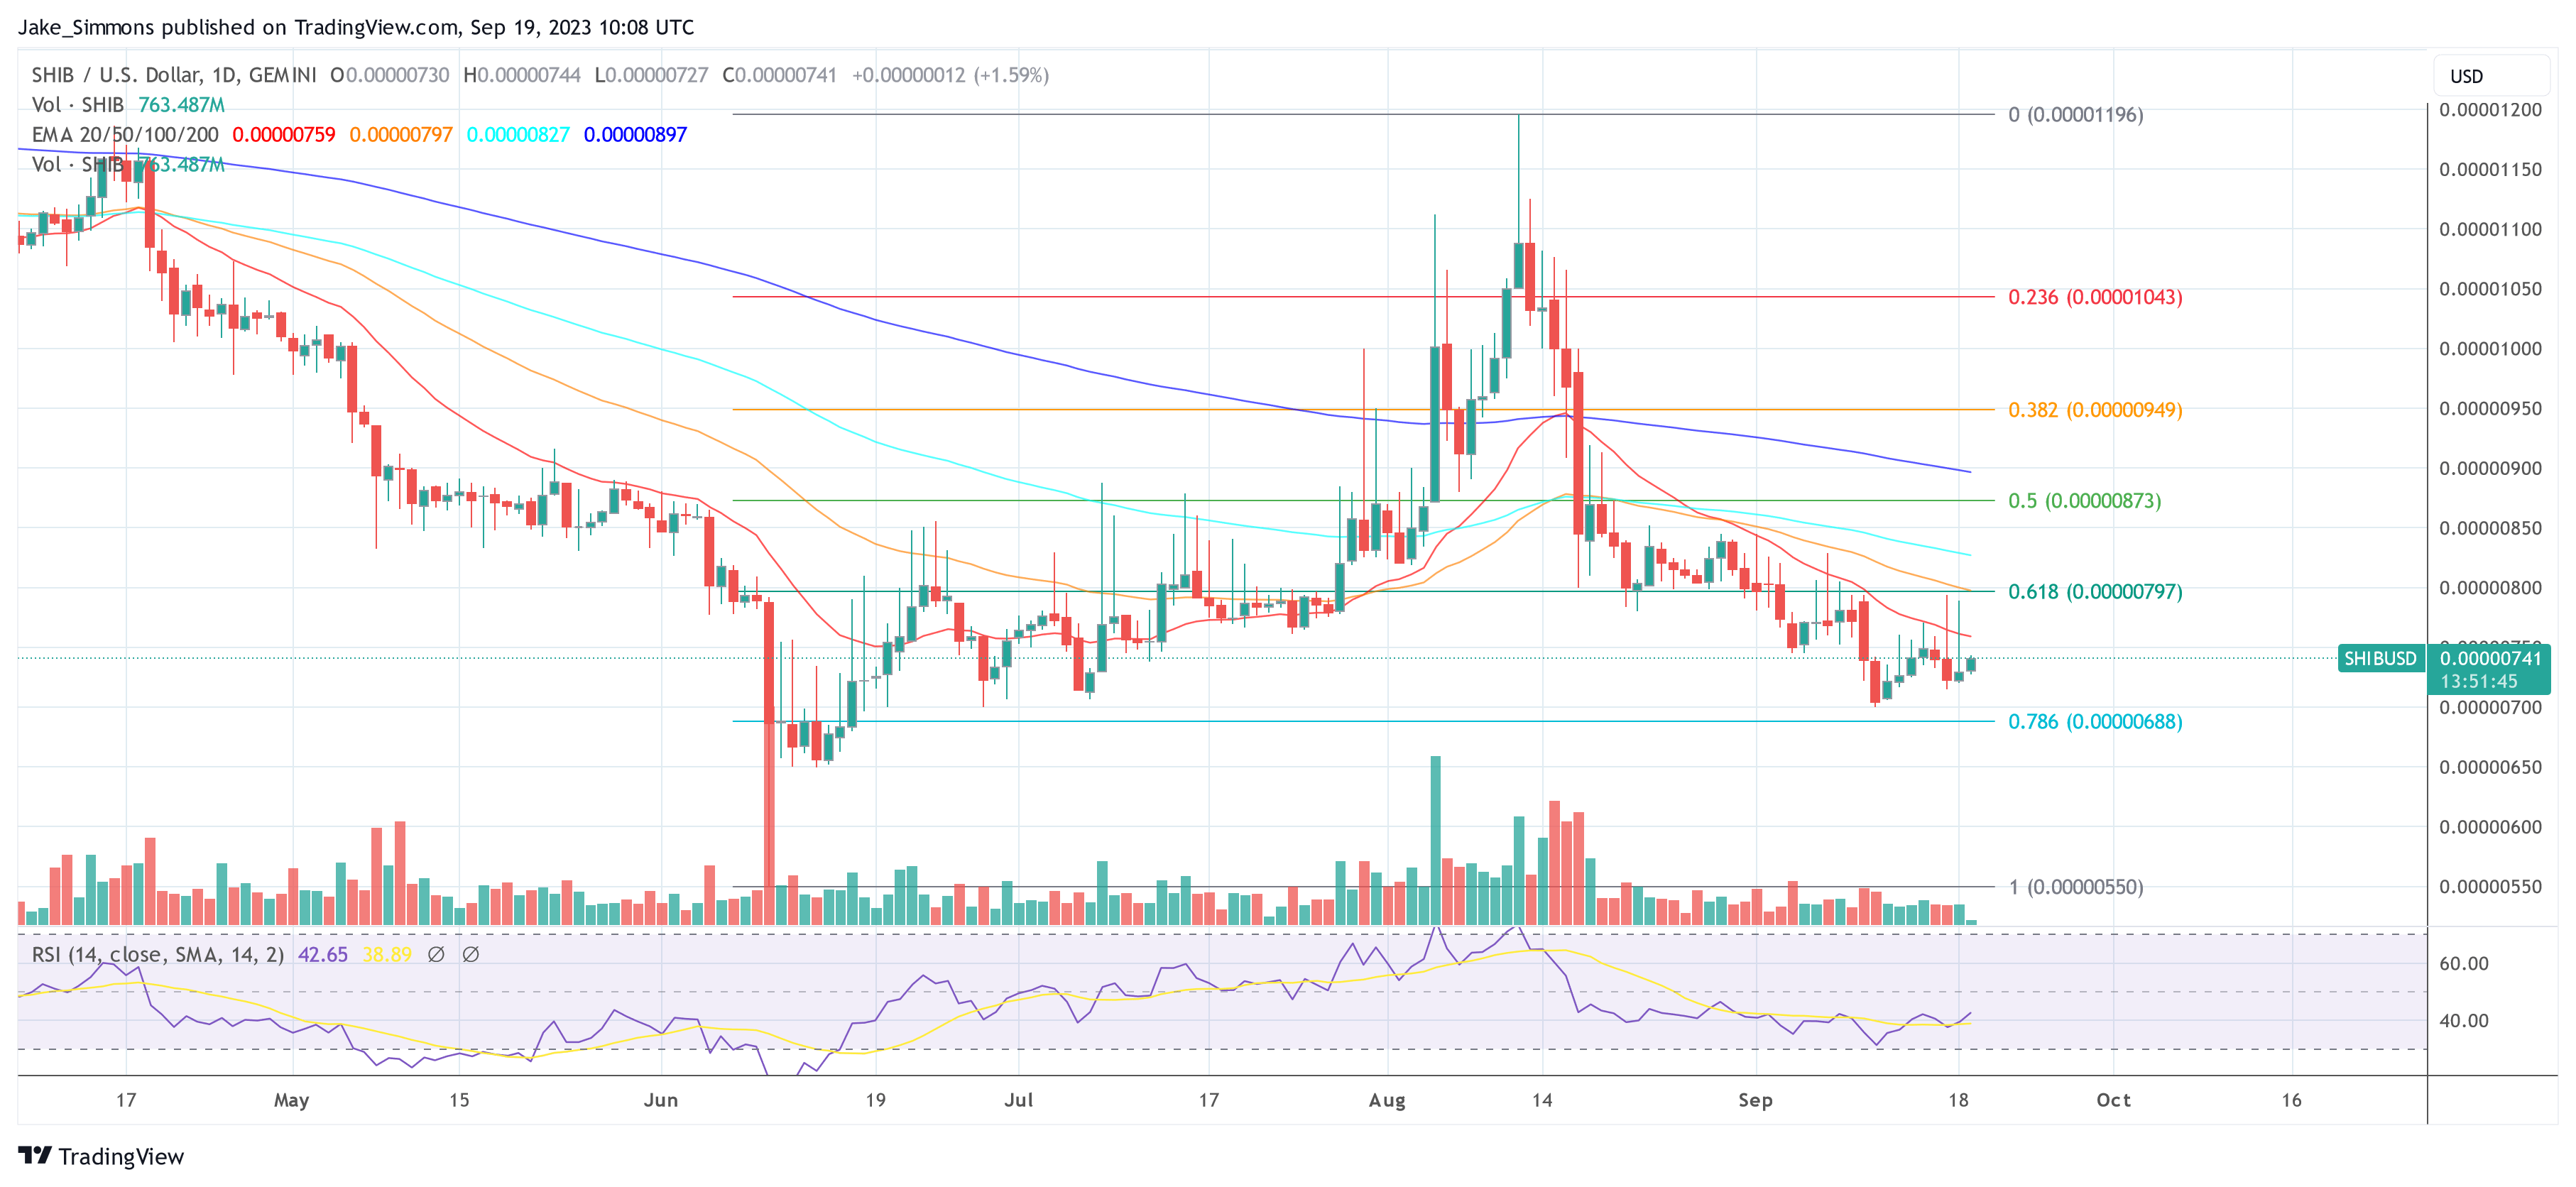
4-Hour Chart: SHIB/USD
In the shorter timeframes, such as the 4-hour chart, we can see that the bulls cannot yet feel secure (yet). SHIB is currently stuck in the trading range between $0.00000688 (78.6% Fibonacci) and $0.00000797 (61.8% Fibonacci). After briefly falling into oversold territory (below 30) on September 11, the RSI has now risen to 42. However, this metric also shows that sentiment remains subdued.
SHIB price urgently needs to break above the 20-day EMA at $0.00000759 on the daily close to generate fresh bullish momentum. Then, resistance at the 61.8% Fibonacci retracement level ($0.00000797) would come into focus. The crossing of this resistance can be seen as a bullish confirmation in the shorter time frames.
Next price targets would then be the 50% Fibonacci retracement at $0.00000873, the 200-day EMA at $0.00000897, the 38.2% Fibonacci retracement at $0.00000949, and the 23.6% Fibonacci retracement at $0.00001043 before the yearly high at $0.00001596 would be within reach. A rise to this price level would mean a 60% rally for Shiba Inu buyers at the current price.


