Solana appears to be gearing up for a major technical breakout, with recent price action building up an interesting chart formation. A familiar bullish pattern has formed, and if validated, it could drive the price to a level not seen in recent weeks. This new development was highlighted by popular analyst Titan of Crypto on social media platform X.
Pattern Breakout Sets $143 In Sight
Like every other large market-cap cryptocurrency, Solana has experienced an extended period of price crashes since late February. In the case of Solana, this price crash has been drawing out since January, when it reached an all-time high of $293 during the euphoria surrounding the Official Trump meme coin. Since then, Solana has corrected massively, even reaching a low of $97 on April 7.
The price action before and after this $97 low has created an interesting formation on the 4-hour candlestick timeframe chart. As crypto analyst Titan of Crypto noted, this formation is enough to send Solana back up to $143.
At the heart of the latest bullish outlook is a clearly defined inverse head and shoulders structure, which is known for its reliability in signaling a reversal from a downtrend to a bullish breakout. The left shoulder of the pattern began forming in early April as Solana attempted to rebound from sub-$110 levels. The subsequent drop to the $96 bottom on April 7 formed the head of the structure. From there, a recovery started as buyers cautiously stepped back in, giving rise to the right shoulder.
The breakout of the neckline resistance has taken place in the past 24 hours. With this in mind, Titan of Crypto predicted that $143 becomes the next logical destination based on the measured move from the head to the neckline.
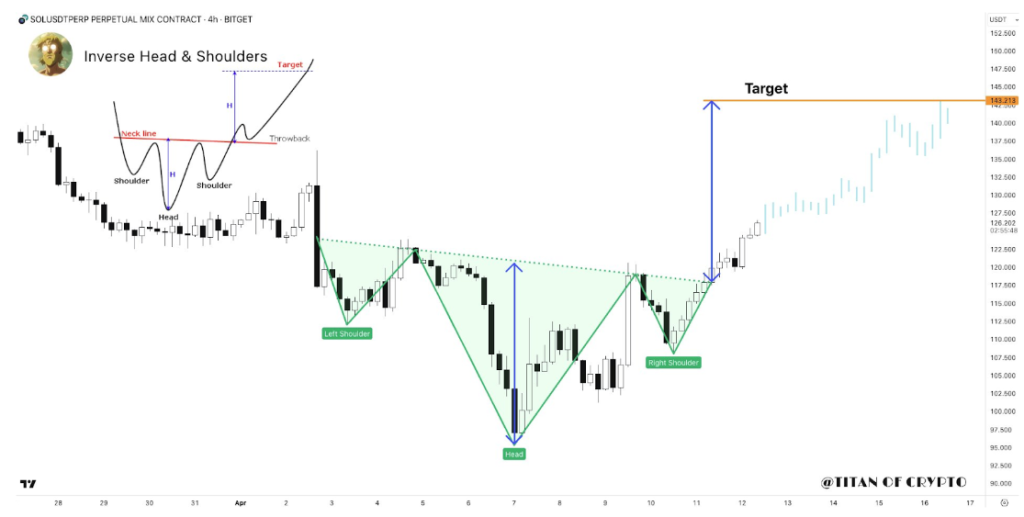
Image From X: Titan of Crypto
Momentum Strengthens With Structure Confirmation
Looking at the chart shared by the analyst, the momentum behind Solana’s price movement appears to be gaining strength. Trading volume is an important metric in evaluating the strength of a breakout, and the volume accompanying the recent breakout above the neckline seemingly confirms it.
Particularly, Solana has seen a 5.3% increase in its price during the past 24 hours, with trading volume surging by 3.76% within this timeframe to $4.21 billion.
Although it is common to see a throwback or minor consolidation just above the neckline, the projected path suggests continued upside as long as price action holds above that key breakout zone.
At the time of writing, Solana is trading at $129, 10% away from reaching this inverse head-and-shoulder target. A move to $143 would not only represent a meaningful recovery from April’s lows but could also improve the confidence in Solana’s price trajectory moving into Q2. The next outlook is what happens after it reaches this target of $143, which will depend on the general market sentiment.
Featured image from The Information, chart from TradingView


