The Solana price prediction may head to the downside as the dip is likely to worsen because of a recent decline in the crypto world.
SOL/USD Market
Key Levels:
Resistance levels: $120, $130, $140
Support levels: $60, $50, $40
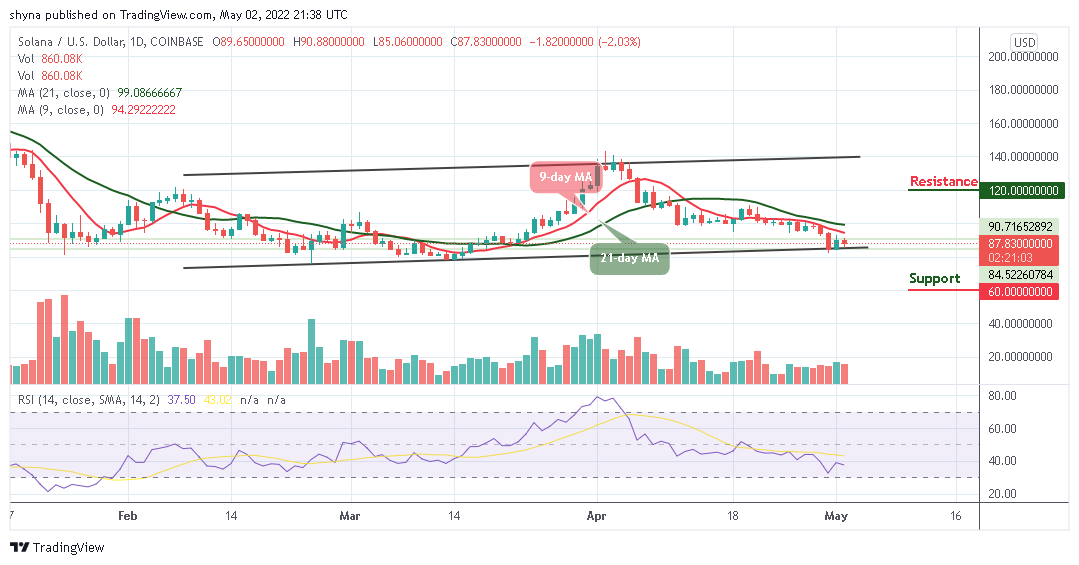
SOL/USD may not be able to continue the bullish movement as the coin may remain below the 9-day and 21-day moving averages. The Solana price is currently trading at $87.83, sliding from the high of $90.88 to face the lower boundary of the channel at the time of writing.
Solana Price Prediction: Would Solana Head to the upside?
Looking at the daily chart, the Solana price is moving sideways, but any bearish movement below the lower boundary of the channel may increase the short-term selling pressure while the critical supports may come around $60, $50, and $40. Meanwhile, any bullish movement above the 9-day and 21-day moving averages may reach the next resistance levels at $120, $130, and $140.
Nevertheless, the technical indicator could start a new bullish session as the Relative Strength Index (14) moves below 40-level. It is, however, not clear how long the session will last because, in the last few weeks, both bullish and bearish sessions have been frequent. Therefore, it is important to watch the resistance and support levels coupled with the movement of other indicators within the daily chart.
SOL/BTC Market: Bears May Dominate the Market
Compared with Bitcoin, the market price is moving downward as the coin trades at 2269 SAT below the 9-day and 21-day moving averages. Looking at the daily chart, if the coin can make a cross above this barrier, the bulls may push the price towards the upper boundary of the channel.
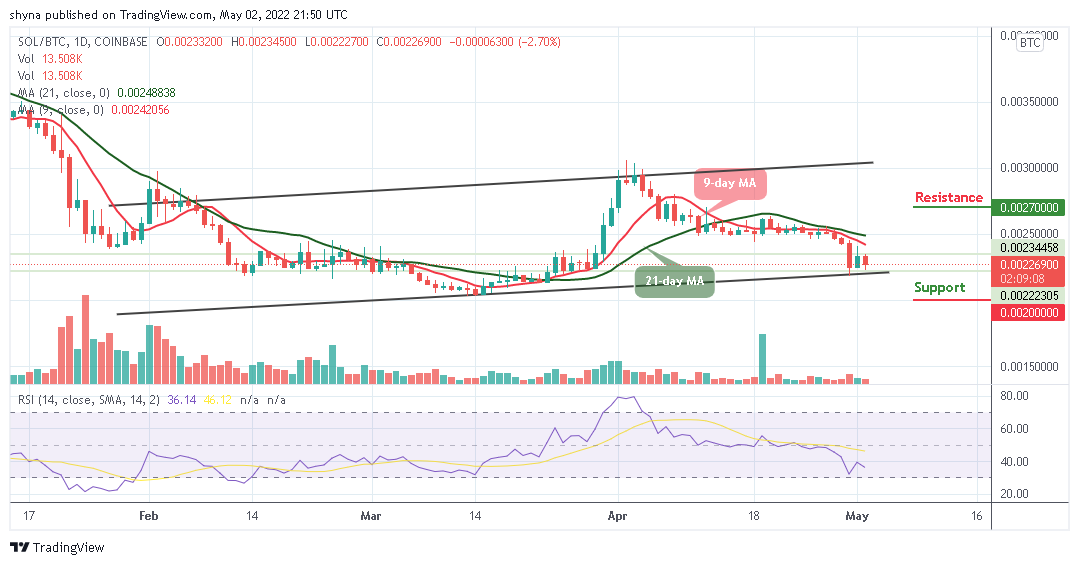
However, if the market drops below the current market value at 2269 SAT, the next key support may come at 2000 SAT and below. On the bullish side, a possible rise may push the market above the 9-day and 21-day moving average to hit the resistance level of 2700 SAT and above. As revealed by the technical indicator, the Relative Strength Index (14) who is the owner of the market may begin to follow the upward movement as the signal line heads below the 40-level.


