The daily chart reveals that the Solana price prediction is ready for a long-entry level near the support level of $40 level.
SOL/USD Market
Key Levels:
Resistance levels: $100, $110, $120
Support levels: $20, $10, $5
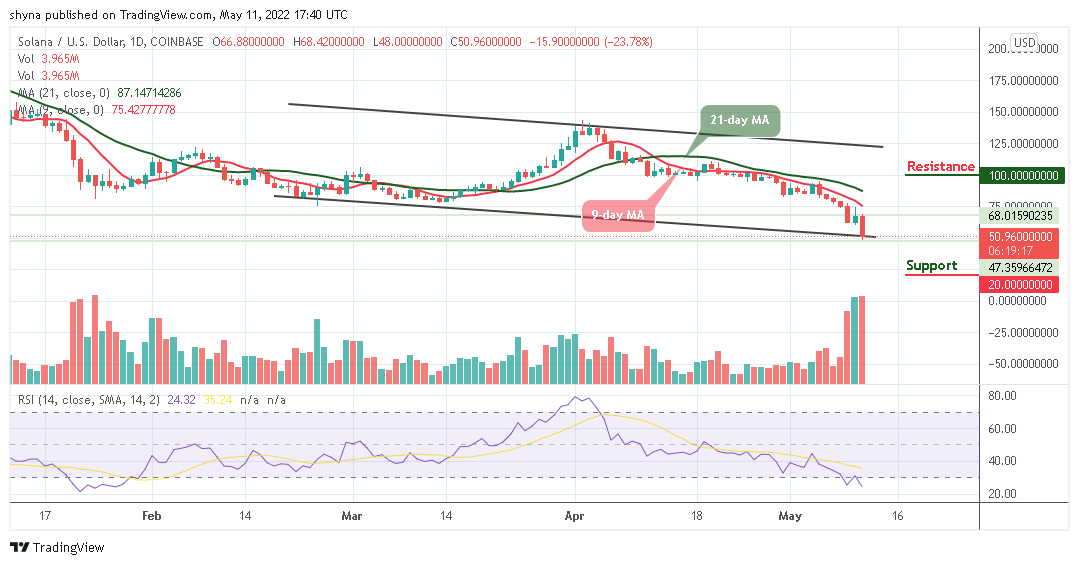
At the time of writing, SOL/USD is moving towards the lower boundary of the channel as the coin dives below the 9-day and 21-day moving averages. However, the technical indicator Relative Strength Index (14) also slides into the oversold region. Meanwhile, a decreasing volume index also suggests a breakdown, but a death cross is likely to come into the picture if the coin crosses below the channel.
Solana Price Prediction: Solana (SOL) May Stay at the Downside
The Solana price is moving below the 9-day and 21-day moving averages as supports are expected at $40 and $30 respectively. The Relative Strength Index (14) continues to flash a sell signal which may be adding weight to the bearish outlook. However, if the 21-day moving average applied to this chart, turned into the support area for this coin, then, the declines are unlikely to extend below $45.
Moreover, should in case the daily bearish candle closes below $50, there is a high probability that the price may reach the support levels of $20, $10, and $5. Meanwhile, if the Solana bulls push the price to cross the moving averages, an increase in buy orders might create enough volume to support gains beyond $80. Any further bullish movement may reach the resistance levels of $100, $110, and $120 respectively.
When compared with Bitcoin, traders can see that Solana’s performance has been bearish. At the time of writing, the coin is staying under the 9-day and 21-day moving averages. Breaking below the lower boundary of the channel could further drag the market to the nearest support level at 1300 SAT and below as the Relative Strength Index (14) moves to cross below the 30-level; possible selling pressure is likely if it continues to drop.
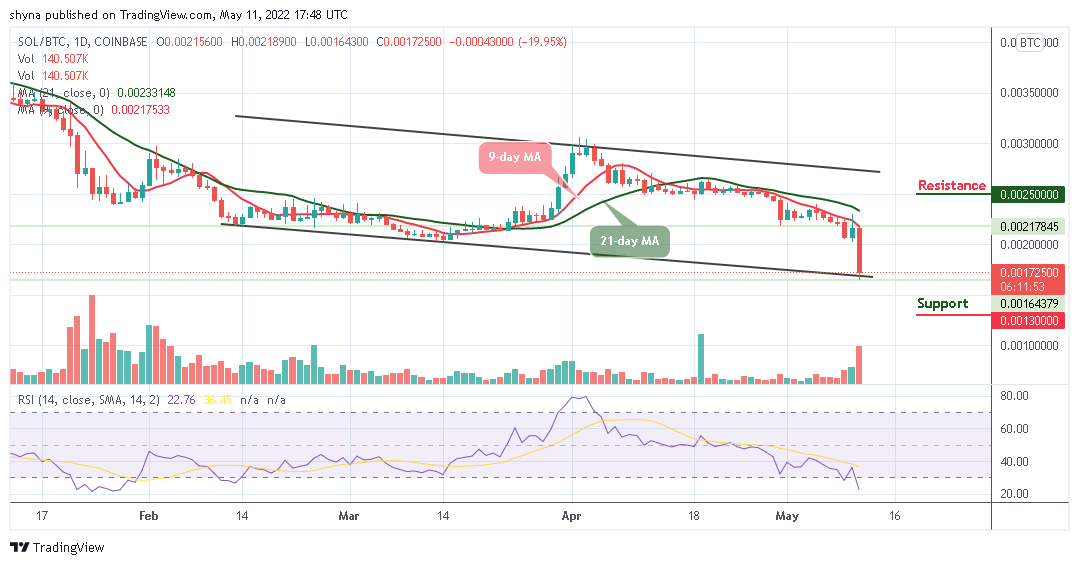
However, SOL/BTC is currently changing hands at 1725 SAT but if the bulls can hold the price tight and push it above the 9-day and 21-day moving averages, the next key resistance could be at 2200 SAT and 2400 SAT respectively. Reaching these levels might move it to the potential resistance at 2500 SAT and above.


