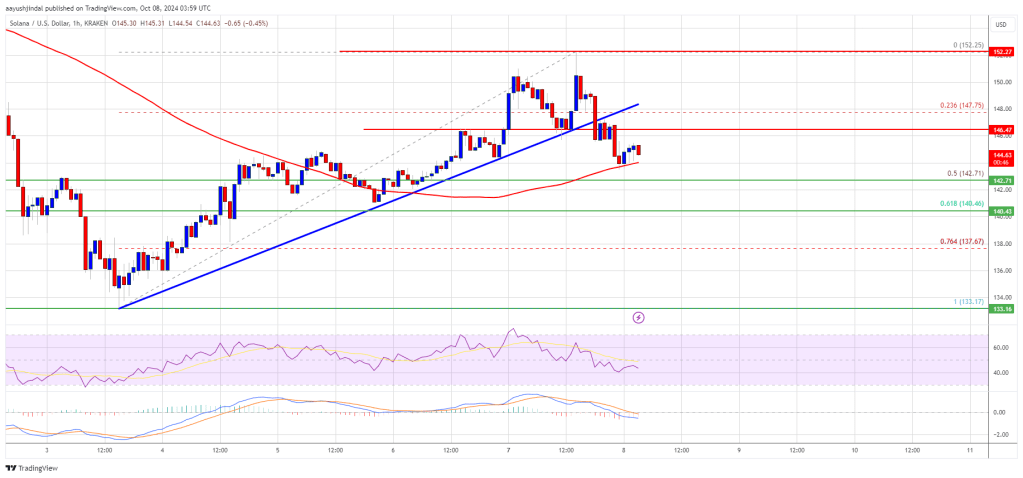
Solana trimmed gains and declined below the $146 support. SOL price is consolidating and might aim for a fresh increase unless there is a break below $140.
- SOL price started a fresh decline below the $146 zone against the US Dollar.
- The price is now trading near $145 and the 100-hourly simple moving average.
- There was a break below a key bullish trend line with support at $149 on the hourly chart of the SOL/USD pair (data source from Kraken).
- The pair could start a fresh increase if it stays above the $140 support zone.
Solana Price Corrects Gains
Solana price climbed above the $145 and $146 levels before the bears appeared. SOL traded as high as $152 and recently started a downside correction like Bitcoin and Ethereum.
The price declined below the $150 and $146 support levels. There was a break below a key bullish trend line with support at $149 on the hourly chart of the SOL/USD pair. The pair slipped below the 23.6% Fib retracement level of the upward move from the $133 swing low to the $152 high.
Solana is now trading near $145 and the 100-hourly simple moving average. The bulls seem to be active above the $142 support and the 50% Fib retracement level of the upward move from the $133 swing low to the $152 high.
On the upside, the price is facing resistance near the $146.50 level. The next major resistance is near the $150 level. The main resistance could be $152. A successful close above the $150 and $152 resistance levels could set the pace for another steady increase. The next key resistance is near $160. Any more gains might send the price toward the $172 level.
More Downsides in SOL?
If SOL fails to rise above the $146.50 resistance, it could start another decline. Initial support on the downside is near the $142 level. The first major support is near the $140 level.
A break below the $140 level might send the price toward the $132 zone. If there is a close below the $132 support, the price could decline toward the $120 support in the near term.
Technical Indicators
Hourly MACD – The MACD for SOL/USD is gaining pace in the bearish zone.
Hourly Hours RSI (Relative Strength Index) – The RSI for SOL/USD is below the 50 level.
Major Support Levels – $140 and $142.
Major Resistance Levels – $150 and $152.


