Menu

Categories:

Hot right now:

Follow on:

Coinsurges provides coverage of fintech, blockchain, and Bitcoin, delivering the most recent news and analyses on the future of money. Stay up-to-date with live prices, charts, and trading options for the top exchanges. Keep track of the day's top cryptocurrency gainers and losers, as well as which coins have experienced gains and losses in the past 24 hours.
Trust Coinsurges as your go-to source for all news and updates in the industry.

Solana (SOL) Holds Steady After Decline—Breakout or More Downside?

Share This Post

Solana started a fresh decline below the $132 support zone. SOL price is now consolidating and might struggle to recover above the $126 resistance.

  • SOL price started a recovery wave from the $122 support zone against the US Dollar.
  • The price is now trading below $130 and the 100-hourly simple moving average.
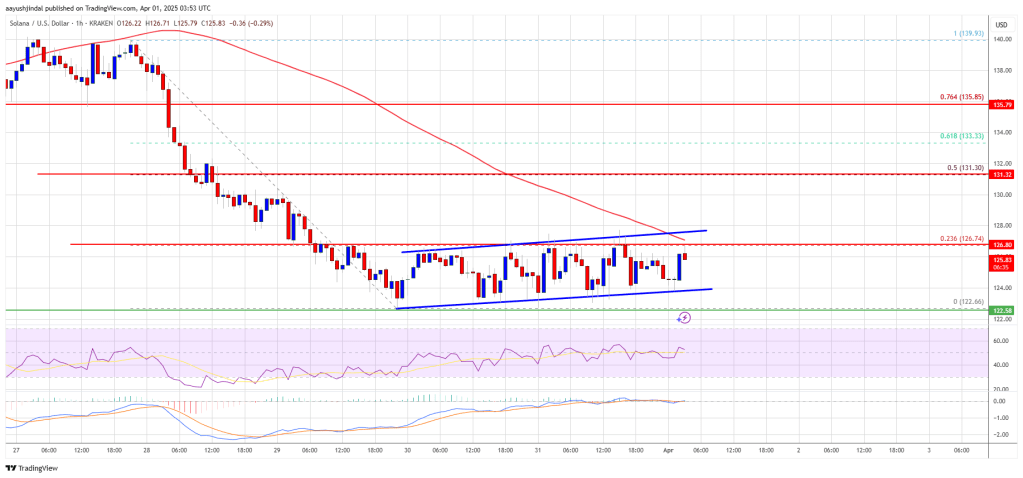
  • There is a key rising channel forming with support at $124 on the hourly chart of the SOL/USD pair (data source from Kraken).
  • The pair could start a fresh increase if the bulls clear the $126 zone.

Solana Price Faces Resistance

Solana price started a fresh decline below the $135 and $132 levels, like Bitcoin and Ethereum. SOL even declined below the $125 support level before the bulls appeared.

A low was formed at $122.64 and the price recently started a consolidation phase. There was a minor increase above the $125 level. The price tested the 23.6% Fib retracement level of the downward move from the $140 swing high to the $122 low.

Solana is now trading below $126 and the 100-hourly simple moving average. There is also a key rising channel forming with support at $124 on the hourly chart of the SOL/USD pair.

On the upside, the price is facing resistance near the $126 level. The next major resistance is near the $128 level. The main resistance could be $132 or the 50% Fib retracement level of the downward move from the $140 swing high to the $122 low.

Solana Price

A successful close above the $132 resistance zone could set the pace for another steady increase. The next key resistance is $136. Any more gains might send the price toward the $142 level.

Another Decline in SOL?

If SOL fails to rise above the $128 resistance, it could start another decline. Initial support on the downside is near the $124 zone. The first major support is near the $122 level.

A break below the $122 level might send the price toward the $115 zone. If there is a close below the $115 support, the price could decline toward the $102 support in the near term.

Technical Indicators

Hourly MACD – The MACD for SOL/USD is losing pace in the bearish zone.

Hourly Hours RSI (Relative Strength Index) – The RSI for SOL/USD is above the 50 level.

Major Support Levels – $124 and $122.

Major Resistance Levels – $128 and $132.

Read Entire Article
spot_img
- Advertisement -spot_img

Related Posts

XRP ETF Launch Impresses Even In Bear Market, Says Analyst

Teucrium’s newly launched 2x XRP ETF on the New York Stocks Exchange recorded $543 million in turnover during its first day of trading on April 8, despite XRP prices hitting a five-month low

Selling Bitcoin To Cover Debt? Michael Saylor’s Strategy Flashes Warning

Strategy, the software company led by Michael Saylor, might need to sell some of its massive Bitcoin holdings to pay its bills The company revealed this possibility in a regulatory filing on April 7,

XRP Primed for a Comeback as Key Technical Signal Hints at Explosive Move

XRP’s recent recovery has sparked fresh optimism among traders, but what’s happening behind the scenes tells an even more compelling story This isn’t just a typical bounce; the charts reveal a

Openzeppelin Open Sources Relayers and Monitor Tools, Expanding Support to Solana and Stellar

Openzeppelin has announced the release of alpha Open Source versions of its Relayers and Monitor tools With over 40 million transactions executed through Relayers and 45 million alerts triggered via

Dogecoin Wyckoff Accumulation: What The Current Chart Says About Price

Dogecoin (DOGE), the largest meme coin in the market, is showing signs of a potential trend reversal following the emergence of a textbook Wyckoff Accumulation pattern A crypto analyst has provided

Cardano Price Prediction: ADA Set To Crash To $0.4 After Correction To Liquidity Zone

Cardano (ADA) has found itself once again caught in a downward current as bearish sentiment grips the broader crypto market The ADA/USDT pair on Binance is now painting a structure that many crypto