Solana (SOL) has seen a nearly 40% retrace over the past month, losing key support levels since February. As its price retests a key horizontal level, some analysts warn of a potential 50% correction to a yearly low.
Solana Loses Key Support Level
Solana has been one of the leading cryptocurrencies of the cycle, fueled by the market’s memecoin frenzy. The altcoin climbed over 270% in a year to its latest all-time high (ATH) of $270, registered nearly two months ago.
Nonetheless, SOL’s bullish sentiment has significantly decreased since January, recently plummeting to its lowest point in over a year. As a result, the cryptocurrency has dropped over 50% from its January 19 ATH.
Solana lost the key $200-$220 support zone at the start of last month, with the February market crashes sending SOL to retest its next crucial levels. After losing the $180 mark two weeks ago, its price hovered between the $130-$150 range, surging to the $179 mark at the start of March.
This week’s market correction, which saw Bitcoin (BTC) drop to $76,000 for the first time in four months, has sent Solana to new monthly lows.
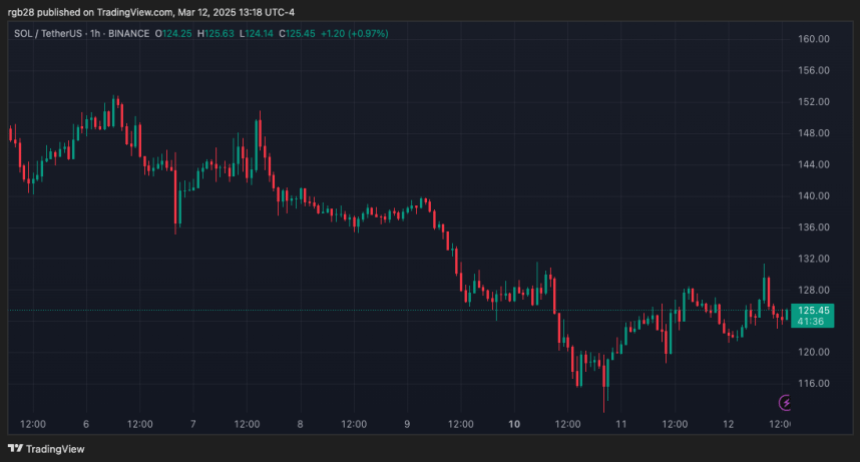
On Tuesday, SOL’s price briefly dropped to $111, a level not seen since the August 2024 market crash, before bouncing back to $125. Amid the ongoing retest, pseudonym trader Crypto Busy warned that SOL must “hold this crucial support to maintain a bullish sentiment above $100.”
Crypto analyst Ali Martinez previously noted that the most crucial zone for Solana appears to be between $110 and $125, as this horizontal level served as a key support during its 2021 and 2024 rallies. The analyst suggested that “holding above this range could be key for the next move.”
SOL Price Risks Move To $60
Martinez also pointed out that Solana could be on the verge of a breakdown, as it has broken below its key level. According to the post, SOL risks a 50% crash to the $60 mark if it fails to hold the $125 support zone.
The analyst highlighted that the cryptocurrency has been forming a right angle ascending broadening pattern since March 2024, when it first reclaimed the level during this cycle.
During this period, every higher high on Solana’s chart has created a rising trendline at the top of the pattern, while the $125 support has held “as a strong horizontal support trendline.”
However, SOL’s break below this horizontal zone has increased the odds of a 50% price correction to the Q4 2023 levels. Additionally, Martinez recently warned of a potential correction based on Solana’s trading pair against Bitcoin, which started to resemble ETH/BTC’s chart.
The analyst suggested that the SOL/BTC chart was looking like Ethereum’s trading pair against BTC’s past price action, adding that if it continued to follow this pattern, the SOL/BTC chart could see a drop to the 0.0008 region. After the recent price action, the trading pair hit a 15-month low of 0.0014624 on Tuesday.
As of this writing, Solana trades at $124, a 14% decline in the weekly timeframe.