Solana has been under intense selling pressure since reaching its all-time high in late January. The price has struggled to regain momentum, facing negative sentiment as the meme coin market continues to decline, significantly impacting Solana’s ecosystem. Analysts suggest that speculative meme coin trading is one of the primary reasons altcoins, including SOL, have underperformed compared to Bitcoin.
Crypto analyst Jelle shared a technical analysis on X, highlighting that the SOL/BTC pair is breaking down from a key support level. However, Jelle also noted that there are still 2 days and 15 hours left before the candle closes, meaning the final outcome remains uncertain. If the breakdown is confirmed, SOL could see further declines against BTC, signaling continued weakness in the altcoin market.
Solana’s performance has been closely tied to meme coin speculation, which initially fueled its surge but is now leading to downside pressure. The next few days will be crucial in determining whether SOL can reclaim key support levels or if further downside awaits. Investors are closely watching BTC’s dominance and Solana’s ability to hold its ground as the broader market seeks clarity on altcoins’ role in this cycle.
Solana Faces A Big Test
Solana is now trading at its lowest levels since November 2024, effectively erasing all the gains from the post-election rally. Once a leading altcoin that outperformed many in the market, Solana is now struggling to regain momentum amid a broader sell-off. Meme coin speculation, which was once a catalyst for its meteoric rise, has now become a major risk factor, contributing to sustained selling pressure and increasing concerns about the network’s long-term sustainability.
This shift in market sentiment was inevitable, as speculative frenzies often result in major corrections. Meme coins, which had driven record-breaking transaction volumes and high network activity, are now seen as a liability rather than an asset. Many investors who flocked to high-risk meme coin trading have either exited the market or are facing significant losses, which has led to reduced liquidity and further price declines.
Jelle shared an analysis on X, revealing that SOL/BTC is breaking down from a key support level. However, he cautioned that the 3-day candle still has 2 days and 15 hours before closing, meaning that a decisive breakdown is not yet confirmed. He also noted that while price action appears weak, a locked-in bullish divergence at support could still occur if buyers step in aggressively before the close.

For now, Solana remains at a critical juncture, with the next few days expected to be pivotal in determining its short-term trend. If bulls manage to defend key support levels, a recovery rally could follow. However, if the sell pressure persists and confidence remains low, SOL could experience further downside, extending its correction phase.
SOL Testing Fresh Demand Levels
Solana is currently trading at $168 after setting a new lower low around $163, signaling that bears still have the upper hand in the short term. Bulls are now testing fresh demand at this level, and they must push the price above $170 as soon as possible to maintain the bullish structure. This level will serve as a key short-term resistance, and reclaiming it would be the first step toward a recovery rally.
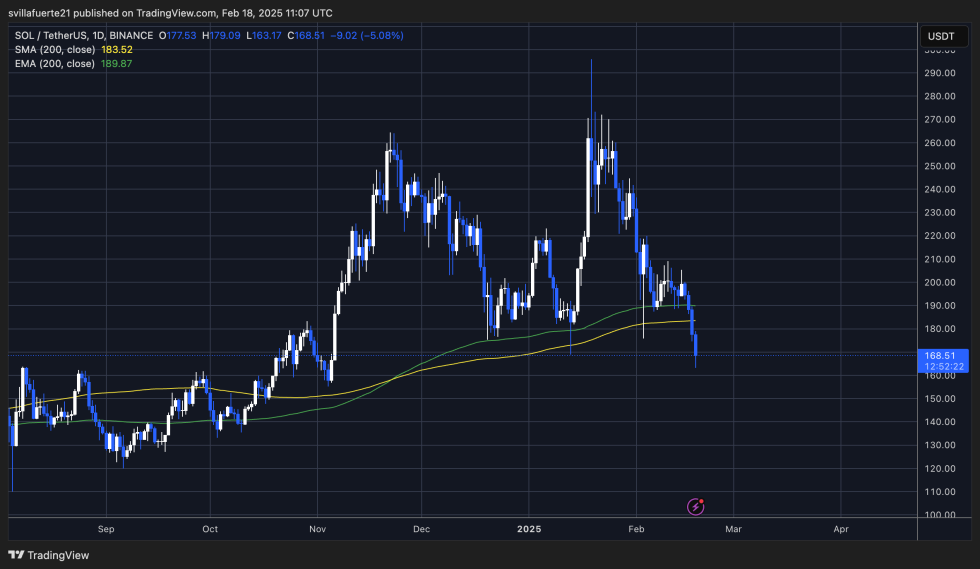
If SOL fails to hold above $170, the risk of a massive correction increases, with the next key support zone around $150. A continued downtrend could expose SOL to deeper losses, especially if broader market sentiment remains bearish.
However, a successful reclaim of the $170 mark followed by a breakout above $190 in the coming days would be a strong signal of strength. A move above $190 would suggest that bulls are regaining control, setting the stage for a potential push back toward $200 and higher supply zones.
Featured image from Dall-E, chart from TradingView