Solana extended losses below the $150 support zone. SOL price is consolidating and might recover if it clears the $152.50 resistance zone.
- SOL price declined further and even traded below $150 against the US Dollar.
- The price is now trading below $160 and the 100-hourly simple moving average.
- There is a connecting bearish trend line forming with resistance at $150 on the hourly chart of the SOL/USD pair (data source from Kraken).
- The pair could clear the $152.50 resistance to start a short-term recovery wave.
Solana Price Eyes Recovery
Solana price remained in a short-term bearish zone like Bitcoin and Ethereum. SOL extended losses below the $160 support zone and is now consolidating losses. It is stuck below the $150 level.
There was a minor move above the 23.6% Fib retracement level of the downward move from the $163.25 swing high to the $145.03 low. Solana price is now trading below $155 and the 100-hourly simple moving average. Immediate resistance is near the $150 level.
There is also a connecting bearish trend line forming with resistance at $150 on the hourly chart of the SOL/USD pair. The next major resistance is near the $152.50 level. A successful close above the $152.50 resistance could set the pace for another major increase.
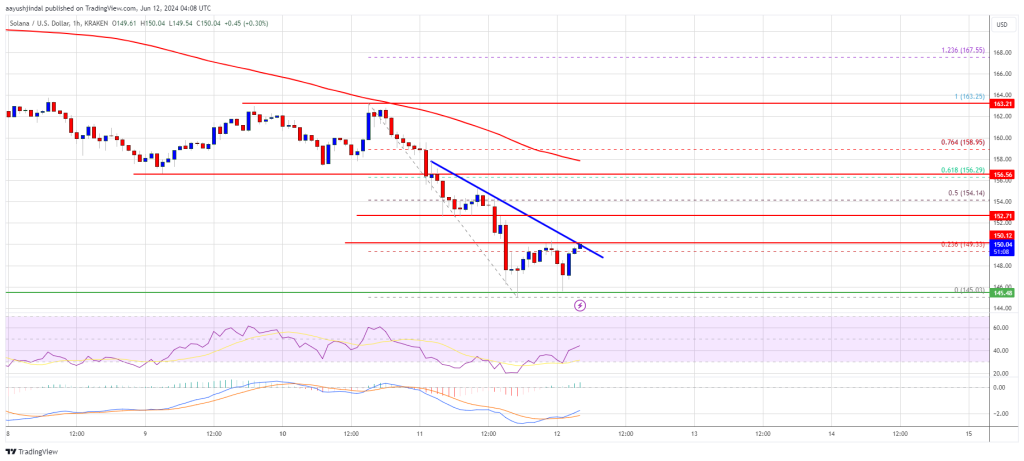
The next key resistance is near $157 or the 61.8% Fib retracement level of the downward move from the $163.25 swing high to the $145.03 low. Any more gains might send the price toward the $165 level.
More Losses in SOL?
If SOL fails to rally above the $152.50 resistance, it could start another decline. Initial support on the downside is near the $145 level.
The first major support is near the $142 level, below which the price could test $135. If there is a close below the $135 support, the price could decline toward the $120 support in the near term.
Technical Indicators
Hourly MACD – The MACD for SOL/USD is losing pace in the bearish zone.
Hourly Hours RSI (Relative Strength Index) – The RSI for SOL/USD is below the 50 level.
Major Support Levels – $145, and $142.
Major Resistance Levels – $152.50, $157, and $165.


