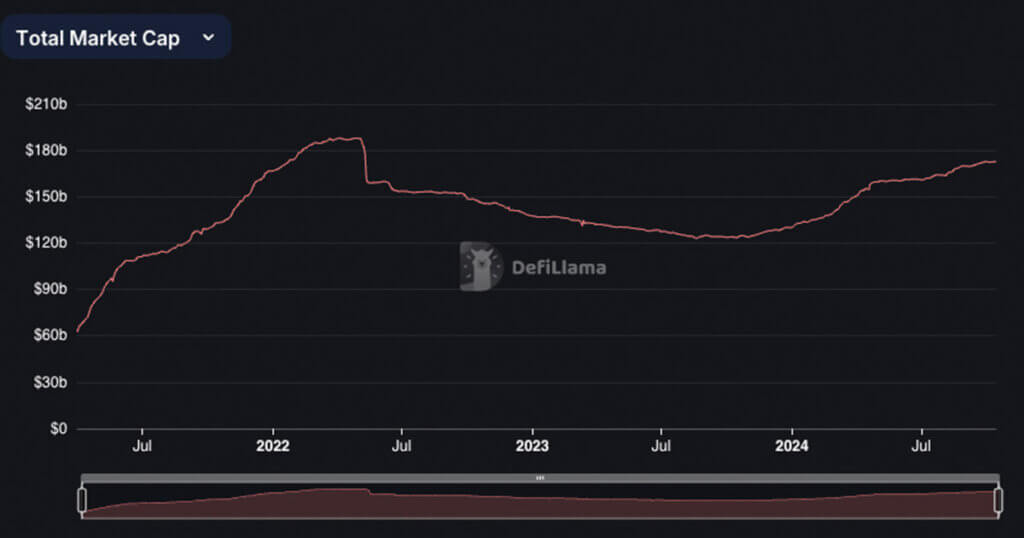
Stablecoin market capitalizations have shifted across multiple blockchains over the past week. The total market cap across all chains has reached $172 billion, just $15 billion away from its all-time high of $187 billion recorded in 2022. The total market cap dropped to $157 billion following the collapse of UST.
According to DefiLama, Ethereum’s stablecoin cap rose by 0.69% to $84.869 billion, with USDT comprising 55.49% of its stablecoin dominance. Tron saw a 0.39% increase to $60.184 billion, dominated by USDT at 98.26%.
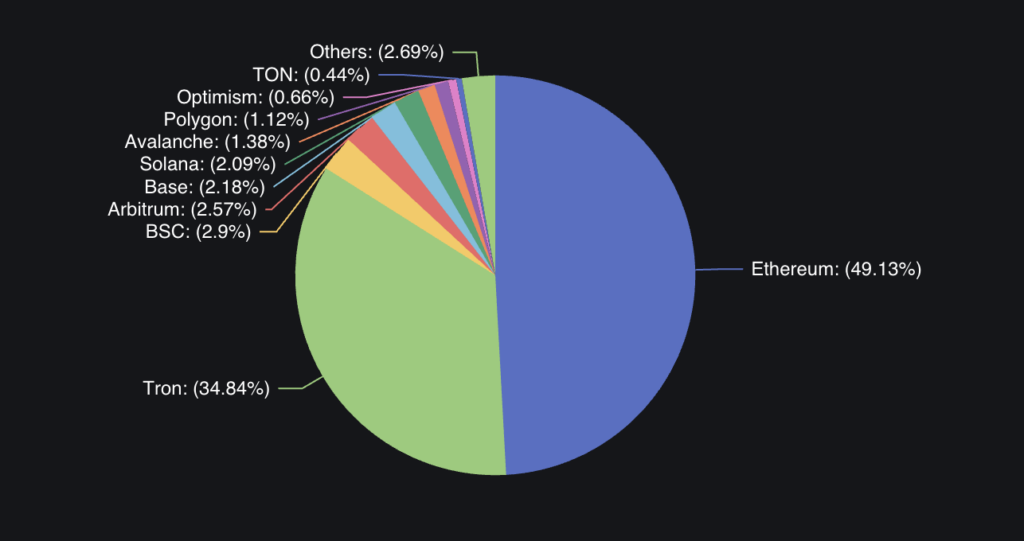
Binance Smart Chain’s stablecoin cap grew by 0.34% to $5.014 billion, with USDT dominating at 79.39%. Arbitrum experienced a slight decrease of 0.67%, bringing its stablecoin cap to $4.433 billion, with USDT accounting for 63.67%. Base’s stablecoin cap increased by 0.97% to $3.758 billion, predominantly in USDC at 92.69%.
Solana faced a decline of 3.30% in stablecoin cap, now at $3.607 billion, with USDC making up 66.35%. Avalanche saw a significant rise of 4.60% to $2.39 billion, dominated by USDT at 65.43%. Polygon’s stablecoin cap increased by 2.15% to $1.928 billion, with USDC holding 52.30% dominance.
Optimism’s stablecoin cap decreased by 5.32% to $1.142 billion, while Near saw a modest increase of 0.17% to $669.38 million. Aptos experienced a notable rise of 9.35% to $254.54 million, with USDC comprising 58.75%.
These shifts indicate changing trends in stablecoin distribution across chains. Factors such as total market capitalization issued on-chain versus bridged assets and the ratio of stablecoin market cap to total value locked (TVL) highlight liquidity movements and user preferences.
Stablecoin issuance vs bridged assets
Stablecoin issuance across blockchains also reveals nuanced trends when comparing the total market capitalization issued on-chain versus bridged assets. On Ethereum, a substantial $95.40 billion in stablecoins have been issued directly on-chain, while only $5.69 million are bridged, emphasizing Ethereum’s role as a primary hub for stablecoin liquidity. Its stablecoin-to-TVL ratio stands at 1.9, reflecting a balanced integration of stablecoins into its DeFi infrastructure.
Tron, by contrast, demonstrates a greater reliance on stablecoins, with $62.36 billion issued and no significant bridged assets, resulting in a higher stablecoin-to-TVL ratio of 8.28. Tron’s focus on efficient stablecoin transactions, particularly for USDT, indicates a more stablecoin-centric use case on the network.
Avalanche, with $2.30 billion in stablecoins issued on-chain and $94.98 million bridged, saw an increase in stablecoin market cap. Its stablecoin-to-TVL ratio of 2.4 reflects moderate reliance on stablecoins within its DeFi ecosystem. Meanwhile, Solana, despite a stablecoin market cap of $3.60 billion and $9.21 million bridged, has a significantly lower ratio of 0.69, signaling reduced stablecoin activity in its DeFi landscape.
Base with $3.76 billion in stablecoins, $134.99 million bridged, and a stablecoin-to-TVL ratio of 1.67, suggesting steady growth in usage. In contrast, Optimism, despite a stablecoin cap of $1.142 billion, has a higher ratio of 1.82, indicating a larger relative presence of stablecoins within its ecosystem despite the recent decline in market cap.
The post Stablecoin market cap closes in on 2022 UST fueled $187 billion peak appeared first on CryptoSlate.


