SUI impressive bullish momentum appears to be losing steam as technical indicators point toward a potential cooldown, with the Relative Strength Index (RSI) signaling overbought conditions, raising concerns about the sustainability of the recent rally.
The $1.4 level is now in focus, as this cooling strength suggests that a pullback could be on the cards, offering a critical moment for SUI as it navigates through growing market pressure. Will the bulls hold their ground, or is a correction set to unfold?
This article aims to analyze SUI’s recent price action in light of technical indicators, particularly the RSI, which suggests a potential cooling of momentum. By examining the implications of overbought conditions and the likelihood of a retest at the $1.4 level, this analysis seeks to provide insight into whether SUI’s bullish trend will continue or if a correction is on the horizon.
Technical Indicators Point To Cooling Momentum: A Turning Point For SUI?
Despite SUI’s price trading above the 100-day Simple Moving Average (SMA) on the 4-hour chart, the cryptocurrency is undergoing a noticeable pullback, aiming to retest the $1.4 level. This suggests that the recent bullish pressure may be slowing as traders reassess key support and resistance zones.
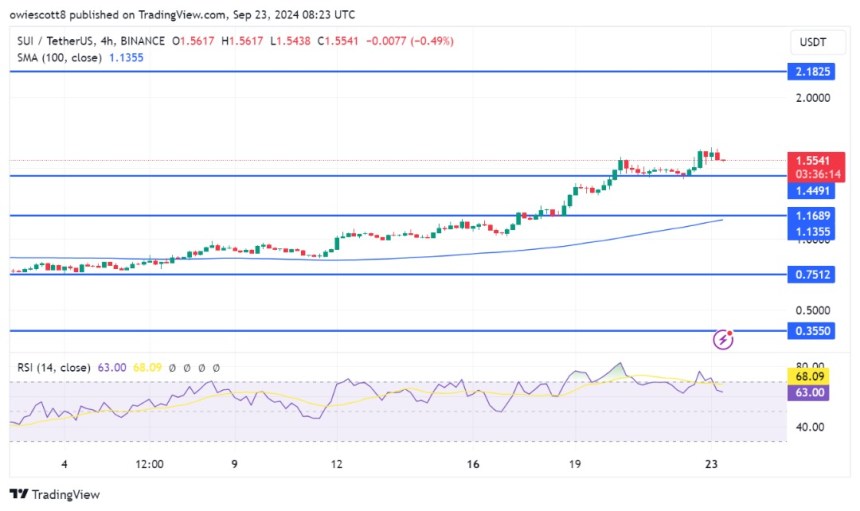
An analysis of the 4-hour Relative Strength Index suggests a potential price drop toward $1.4 as the RSI line is dropping from the overbought zone toward the 50% threshold, indicating that SUI’s bullish momentum may be losing strength.
Also, on the daily chart, SUI is showing bearish sentiment as it attempts to retest the $1.4 mark. Since breaking above the 100-day SMA, the price has experienced a consistent upward trend without any significant pullbacks, indicating that a noticeable correction may be on the horizon.
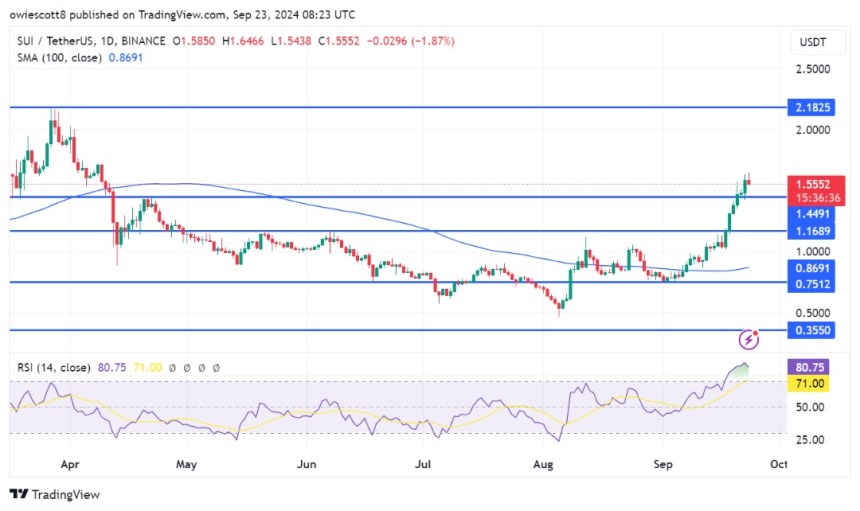
Finally, on the 1-day chart, a detailed analysis of the RSI signal line indicates that it has surpassed the 50% threshold and is currently at an impressive 82%. This high reading raises concerns about potential overbought conditions, which could trigger a market correction or pullback.
$1.4 Retest Looms: What Traders Should Watch For Next
As SUI approaches the critical $1.4 level, traders should be vigilant, as a breach below this point could indicate a potential move toward the $1.16 support level. If the price breaks below $1.16, it may signal a further decline toward the $0.8690 level and beyond.
However, if SUI experiences a strong rebound at the $1.4 level, the price may start to rise again toward its all-time high of $2.18. A breakout above this level could indicate a continuation of the upward trend, possibly paving the way for a new all-time high.
At the time of writing, SUI was trading at approximately $1.55, marking a 5.99% increase over the past 24 hours. The cryptocurrency’s market capitalization was around $4.1 billion, with trading volume exceeding $964 million, reflecting increases of 5.64% and 151.91%, respectively.


