Ethereum gained bearish momentum below the $1,500 support against the US Dollar. ETH must stay above $1,400 to start a recovery wave.
- Ethereum remained in a bearish zone and extended losses below $1,500.
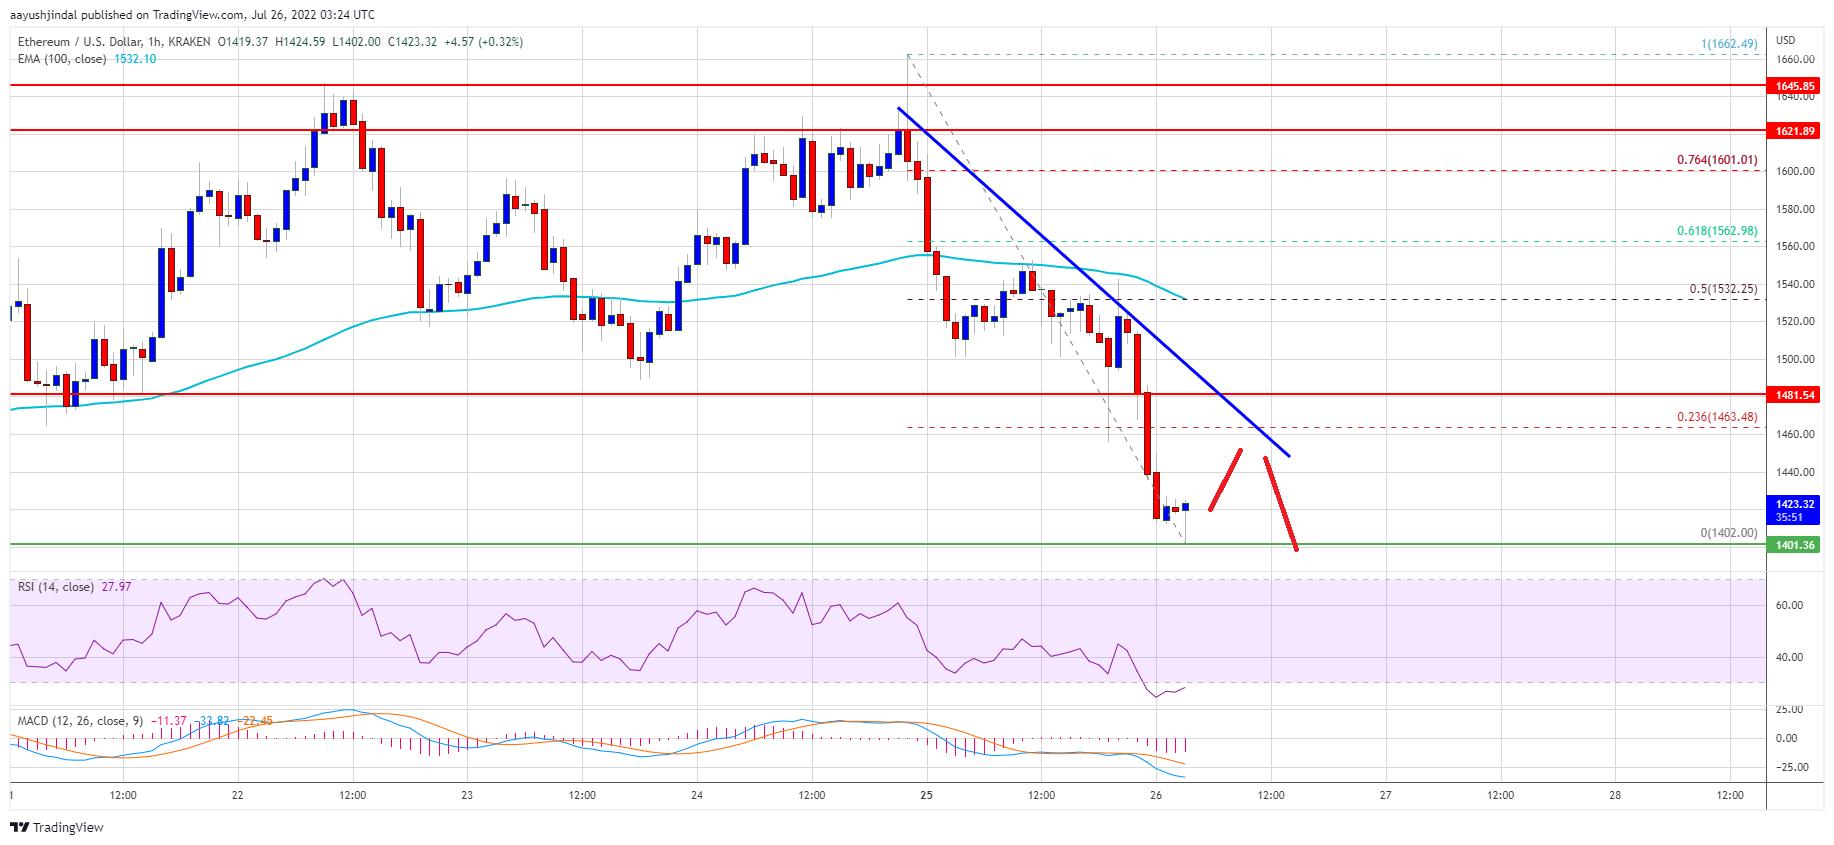
- The price is now trading below $1,500 and the 100 hourly simple moving average.
- There is a key bearish trend line forming with resistance near $1,460 on the hourly chart of ETH/USD (data feed via Kraken).
- The pair could start a recovery wave unless there is a clear move below the $1,400 support.
Ethereum Price Breaks Down
Ethereum failed to recover losses and trade above the $1,550 level. ETH started another decline and traded below the key $1,500 support zone.
It opened the doors for a sharp decline below the $1,450 level. Ether price even tested the $1,400 support zone. A low is formed near $1,402 and the price is now consolidating losses. It is now trading below $1,500 and the 100 hourly simple moving average.
An immediate resistance on the upside is near the $1,440 level. The first major resistance is near the $1,450 zone. It is near the 23.6% Fib retracement level of the downward move from the $1,662 swing high to $1,402 low.
There is also a key bearish trend line forming with resistance near $1,460 on the hourly chart of ETH/USD. A clear move above the trend resistance might send the price towards the $1,500 level. The next major resistance could be $1,550.
Source: ETHUSD on TradingView.com
It is near the 50% Fib retracement level of the downward move from the $1,662 swing high to $1,402 low. The main breakout zone is now forming near the $1,550 zone. A clear move above the $1,550 level could start a decent increase.
More Losses in ETH?
If ethereum fails to rise above the $1,460 resistance, it could continue to move down. An initial support on the downside is near the $1,400 zone.
A clear move below the $1,400 support might push the price towards the $1,375 support zone. Any more losses might even push ether price to the $1,300 support.
Technical Indicators
Hourly MACD – The MACD for ETH/USD is now losing momentum in the bearish zone.
Hourly RSI – The RSI for ETH/USD is now well below the 50 level.
Major Support Level – $1,400
Major Resistance Level – $1,460


