The Terra LUNA price prediction may shoot to the upside as the bulls prepare to take the coin to higher levels.
LUNA/USD Market
Key Levels:
Resistance levels: $105, $110, $115
Support levels: $60, $55, $50
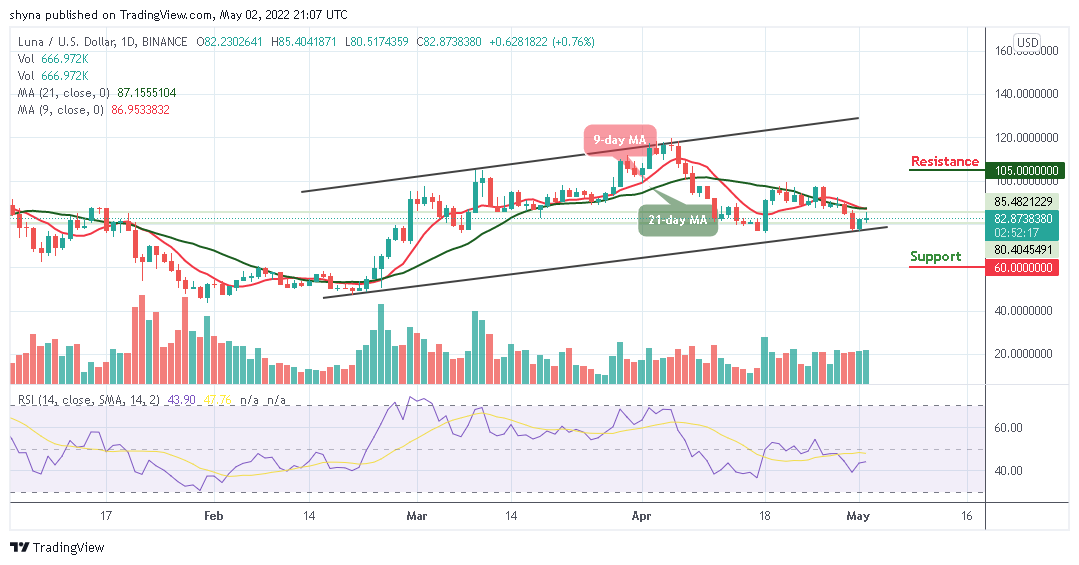
LUNA/USD is trading above $80 as the coin trades near the 9-day and 21-day moving averages to touch the resistance level of $85 during the European session today. The Terra LUNA may continue to move upwards if the price crosses above the 9-day and 21-day moving averages. Meanwhile, LUNA/USD may reach the resistance level of $90 if the bulls focus on the upward trend.
Terra LUNA Price Prediction: LUNA/USD Gets Ready for a Spike
The Terra price may remain on the positive side should the 9-day moving average stays above the 21-day moving average. However, the technical indicator Relative Strength Index (14) is also confirming the bullish movement as the signal line moves to cross above 50-level. Therefore, there is a higher chance that the coin may find the potential resistance levels at $105, $110, and $115.
On the contrary, if the coin slides below the lower boundary of the channel, any bearish movement to the south may bring the coin to reach the nearest support at $70 before locating the critical supports at $60, $55, and $50 respectively.
LUNA/BTC Market: Price May Cross Above the Moving Averages
Against Bitcoin, the Terra LUNA is likely to head to the upside as the coin may push the coin above the 9-day and 21-day moving averages. Therefore, if the bullish movement continues, the next level of resistance may surface, and this may cause the Terra price to locate the key resistance at 2700 SAT and above.
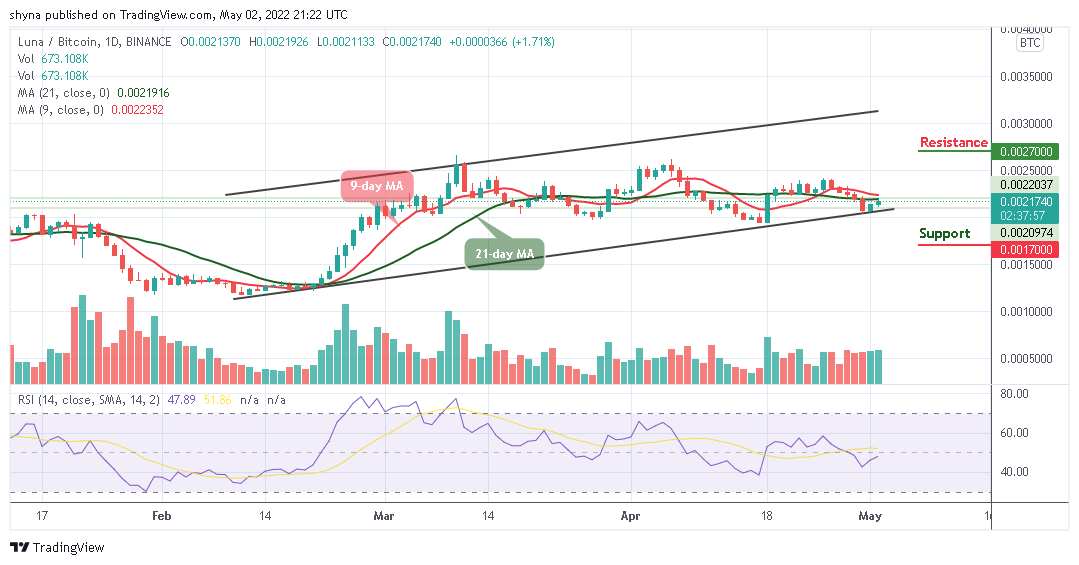
Meanwhile, on the downside, the Terra LUNA price could face support at 1800 SAT. Beneath this, the critical support level could be located at 1700 SAT and below. At the moment, the 9-day MA remains above the 21-day MA as the technical indicator Relative Strength Index (14) moves to cross above 50-level to increase the bullish movement. Meanwhile, if the signal retreats below the 40-level, traders are likely to expect a bearish pressure below the channel.


