Terra Price Prediction – May 15
The Terra price prediction has slumped significantly after witnessing a FUD attack on its native TerraUSD (UST) stablecoin.
Terra (LUNA) Statistics Data:
LUNA price now – $0.00022
LUNA market cap – $1.4 billion
LUNA circulating supply – 6.5 billion
LUNA total supply – 6.9 trillion
LUNA Coinmarketcap ranking – #211
LUNA/USD Market
Key Levels:
Resistance levels: $1, $2, $3
Support level: $0.00000100 (this could be 2022 low)
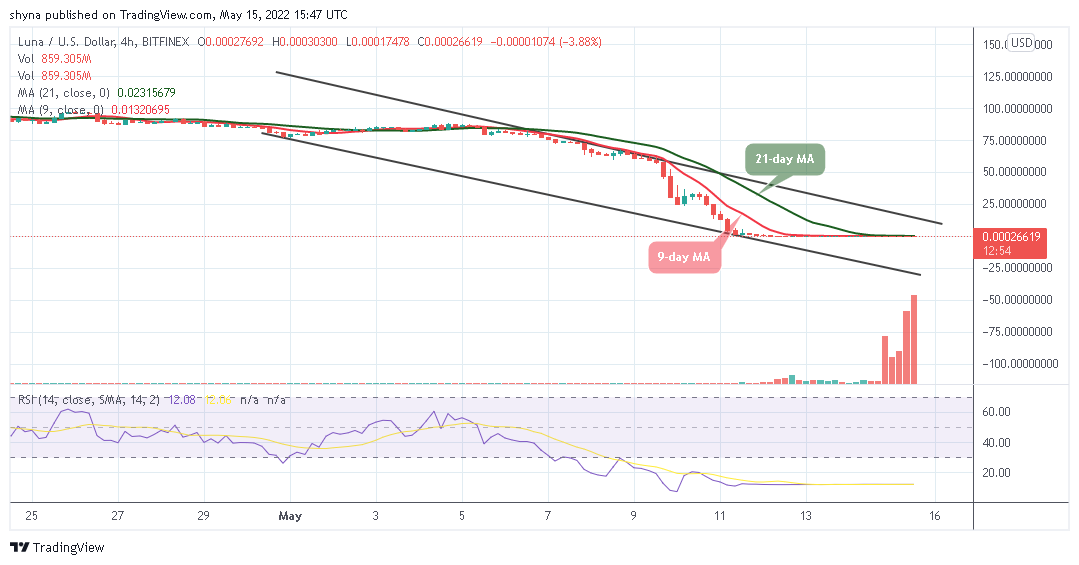
At the time of writing, LUNA/USD is experiencing extreme volatility as the daily chart shows that the LUNA price is in a deep zone. Moreover, LUNA collapsed to virtually zero as the entire market is down as the 9-day moving average remains below the 21-day moving average.
Terra Price Prediction: Will There Be Any Recovery Plan for Terra (LUNA)?
According to the 4-hour chart for Terra price, the technical indicator Relative Strength Index (14) remained below the 20-level within the oversold region. In the last few days of trading, many altcoins have followed suit by experiencing massive declines. With the hope that the worst is over, it’s exciting to see what the next seven days hold. Again, there are no dull days in cryptocurrencies.
Looking at the crypto market, LUNA serves as a collateral asset to maintain the UST’s dollar parity in line with Terra’s elastic monetary policy. Therefore, when the value of UST is greater than $1, the Terra protocol may ask users to burn LUNA and mint UST.
On the other hand, when the price of UST drops below $1, the protocol rewards users for burning UST and minting LUNA. Therefore, during the reduction of UST supply, LUNA’s valuation should decrease and when UST supply expands, LUNA’s valuation rises as announced by the Terraform Labs.
Against Bitcoin, the LUNA price is largely under selling pressure. The price of Terra is aggressively falling below the 9-day and 21-day moving averages. Meanwhile, the daily chart also reveals range-bound lines to show the pairing instruments that initially appear on it and LUNA/BTC is currently trading below the range.
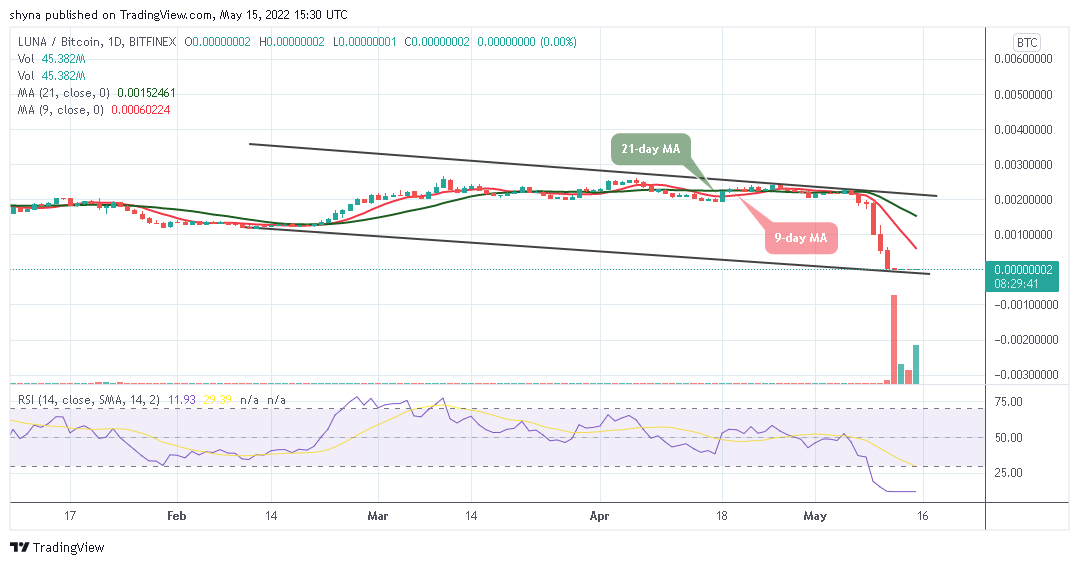
The 9-day moving average has been intercepted on the downside by the 21-day moving average while the Relative Strength Index (14) is in the oversold region, consolidating there.
Looking to buy or trade Terra (LUNA) now? Invest at eToro!
68% of retail investor accounts lose money when trading CFDs with this provider
Read more:


