TON price rallied nearly 15% and traded above the $6.50 resistance. Toncoin is now showing a few signs of trend exhaustion and might correct gains.
- Toncoin jumped above the $6.20 and $6.50 resistance levels.
- The price is now trading above $6.50 and the 100-hourly Simple Moving Average.
- There is a key parabolic curve forming with support at $6.80 on the hourly chart of the TON/USD pair (data source from Kraken).
- The pair could start a downside correction if it declines below $6.80 and the $6.60.
TON Price Reaches $7
Recently, TON price started a strong increase from the $5.60 support zone. It climbed above the $6.20 resistance zone. It gained nearly 15% in a day and outperformed Bitcoin and Ethereum.
Toncoin traded close to the $7.00 level. A high was formed at $6.93 and the price is now consolidating gains. It is trading near the $6.80 zone and well above the 100-hourly Simple Moving Average. There is also a key parabolic curve forming with support at $6.80 on the hourly chart of the TON/USD pair.
Immediate resistance is near the $6.92 level. The first key resistance is near $7.00. A close above the $7.00 resistance zone could spark a strong increase.
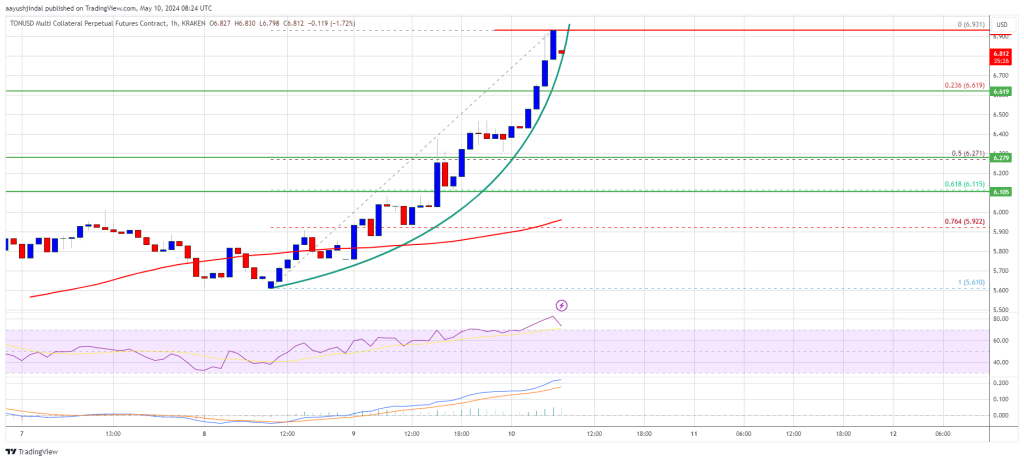
Source: TONUSD on TradingView.com
The next key resistance is near $7.20. If the bulls remain in action above the $7.20 resistance level, there could be a rally toward the $7.55 resistance. Any more gains might send the price toward the $8.00 resistance.
Downside Correction In Toncoin?
If Toncoin price fails to clear the $6.90 resistance zone, it could start a downside correction. Initial support on the downside is near the $6.80 level and the parabolic curve, below which the price might test the 23.6% Fib retracement level of the upward move from the $5.61 swing low to the $6.93 high.
The next major support is at $6.25 or the 50% Fib retracement level of the upward move from the $5.61 swing low to the $6.93 high. If there is a downside break and a close below the $6.25 level, the price might accelerate lower. In the stated case, the price could retest the $6.00 support zone.
Technical Indicators
Hourly MACD – The MACD for TON/USD is now losing pace in the bullish zone.
Hourly RSI (Relative Strength Index) – The RSI for TON/USD is now above the 70 level.
Major Support Levels – $6.80 and $6.60.
Major Resistance Levels – $6.90 and $7.00.


