TON is facing renewed selling pressure as its price takes another dip, putting its recovery efforts in jeopardy. Despite previous attempts to regain bullish momentum, the cryptocurrency now struggles to hold its ground as it slips further below key support levels. With bears seemingly regaining control, the market is closely watching whether the current support levels can hold. As TON struggles to maintain its ground, the outlook becomes increasingly uncertain, with more downside risks looming.
This piece aims to explore TON’s ongoing struggle to regain a bullish trajectory as a fresh price drop threatens its recovery. By delving into recent market shifts, support levels, and technical indicators, we’ll assess the likelihood of a rebound or further declines and provide insights into what could be next for TON and whether the bulls can regain control.
Indicators Point To Further Weakness
TON has recently entered bearish territory on the 4-hour chart, dipping just below the 100-day Simple Moving Average (SMA) and approaching the crucial $4.6 support level. This drop below the 100-day SMA indicates weakening strength, and with sellers taking control, the cryptocurrency faces the potential for more losses.
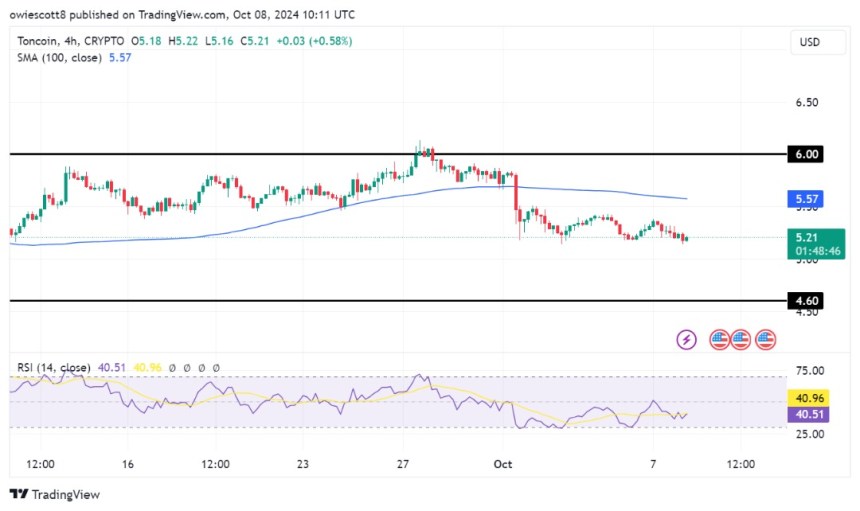
An analysis of the 4-hour Relative Strength Index (RSI) shows that the signal line has dropped to 40%, following a brief rise to the 50% threshold, suggesting that buying pressure is waning as the RSI moves deeper into bearish territory. Typically, an RSI reading below 50% implies that sellers are gaining control, which could lead to downward pressure on the price.
Additionally, TON has exhibited strong bearish momentum on the daily chart, struggling to overcome resistance at $6, as highlighted by the formation of a negative candlestick. With sellers firmly in control and the failure to break above this key level, along with continued trading below the 100-day SMA, there is potential for further downside. Without significant buying interest to counteract the selling pressure, the digital asset may face deeper declines.
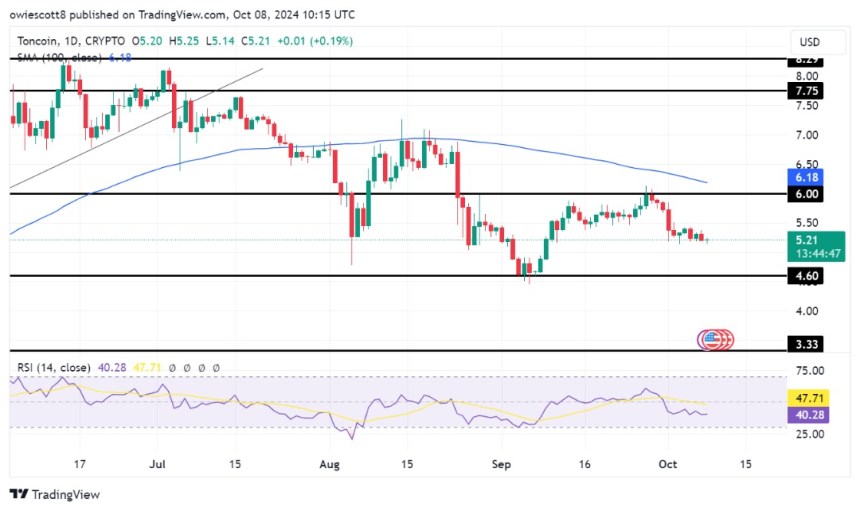
A closer examination of the RSI on the 1-day chart reveals that the RSI signal line is currently sitting at 40%, having dropped below the crucial 50% threshold. With the RSI trending at this level, it signals that selling pressure is increasing, potentially paving the way for more drops unless the bulls can step in to reverse the market’s trajectory.
Potential Scenarios: Will TON Rebound Or Slide Deeper?
TON is currently heading toward the $4.6 support level, where a potential rebound could occur if buyers manage to regain control. A successful recovery from this level may drive the price higher, with the $6 resistance level acting as the next target, potentially reigniting the asset’s recovery momentum.
However, failure to maintain the current support level could result in further declines, with TON possibly dropping toward the $2 price target and even lower levels beyond that.


