Sellers are ruling the world of Tron market
TRXUSD Price Analysis – October 12
The bulls’ momentum became weak and bears gained more power to push the price towards $0.060 support level at the moment. In case more sellers come in this week there is a probability that the Tron will experience further downtrend movement towards the support level of $0.060, below it are $0.059 and $0.057 levels.
TRX/USD Market
Key Levels:
Resistance levels: $0.061, $0.063, $0.064
Support levels: $0.061, $0.058, $0.057
TRX/USD Long-term Trend: Bearish
The buyers of TRX/USD were unable to push the price higher far above the resistance level of $0.070. The price fell due to the bearish pressure towards the support level of $0.058. Some bearish candles were formed which further reduces the price last week. The price carried out retracement towards the resistance level of $0.064. The sellers were able to oppose the bullish movement at the resistance level of $0.064 on October 10. The price is currently heading towards the previous low at $0.058.
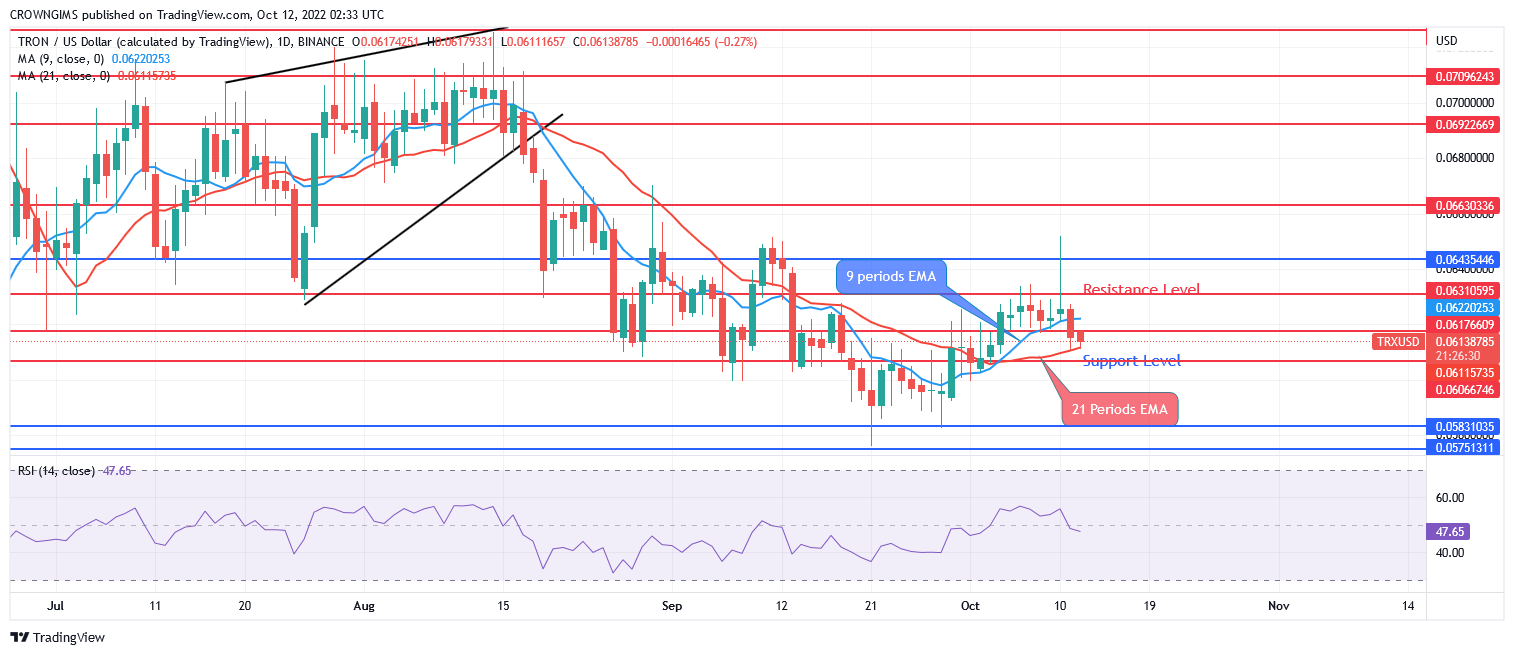
There is probability that the price might go down within the next several trading days as an inverted pin bar candle pattern formed on the daily chart on October 10. On the daily chart, Tron is below the two EMAs with the relative strength index period 14 is at 46 levels with the signal lines pointing towards the south, which indicate a bearish signal.
Your capital is at risk
TRX/USD Price Medium-term Trend: Bearish
TRX/USD on the medium term is bearish. The coin broke up the last week resistance level at $0.062 and it increase to test the resistance level of $0.064 level. The bulls’ momentum became weak and bears gained more power to push the price towards $0.060 support level at the moment.
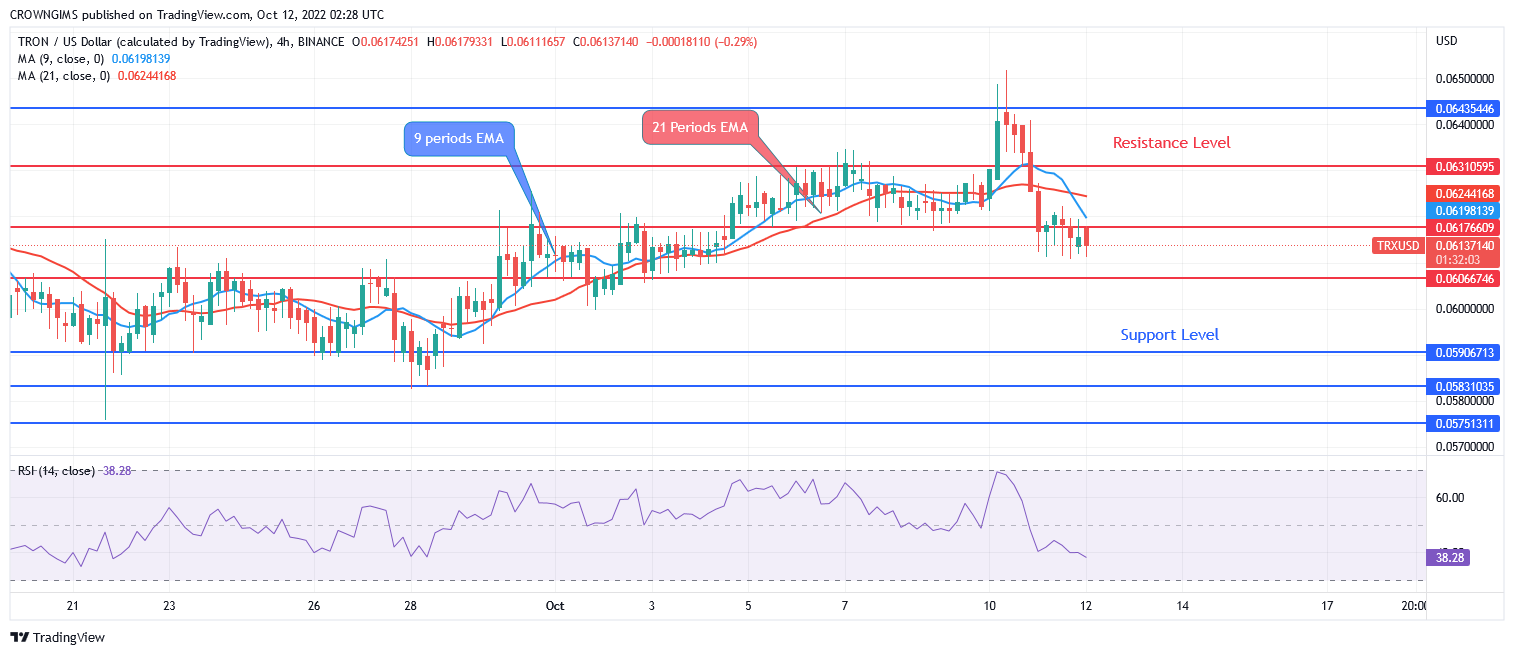
In case more sellers come in this week there is a probability that the price will experience further downtrend movement towards the support level of $0.060, below it are $0.059 and $0.057 levels. The relative strength index period 14 is below 40, with the signal lines directed towards the south indicate further price decrease.
Tamadoge – Play to Earn Meme Coin

- Earn TAMA in Battles With Doge Pets
- Maximum Supply of 2 Bn, Token Burn
- Now Listed on OKX, Bitmart, LBank, MEXC, Uniswap
- Ultra Rare NFTs on OpenSea


