UNI price started a major increase above the $10.50 resistance. Uniswap is showing positive signs and might eye more upsides above the $12.00 resistance.
- UNI started a fresh increase above the $10.50 resistance zone.
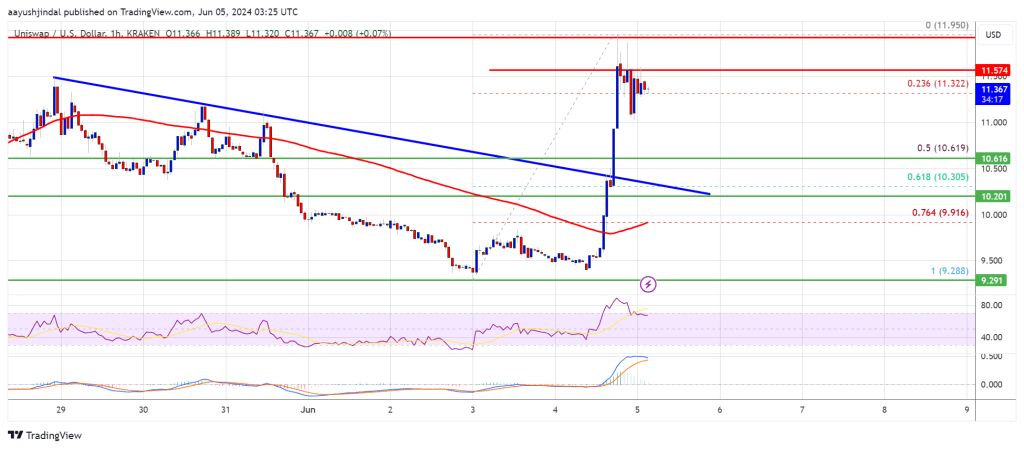
- The price is trading above $11.20 and the 100-hourly simple moving average.
- There was a break above a key bearish trend line with resistance near $10.35 on the hourly chart of the UNI/USD pair (data source from Kraken).
- The pair might correct gains, but the bulls might eye more upsides above $12.00 in the near term.
UNI Price Regains Traction
After forming a base above the $9.20 level, Uniswap started a fresh increase like Bitcoin and Ethereum. UNI price gained pace for a move above the $9.80 and $10.00 resistance levels.
There was a break above a key bearish trend line with resistance near $10.35 on the hourly chart of the UNI/USD pair. The bulls even pushed the price above the $10.50 and $11.50 resistance levels. Finally, the bears appeared near the $12.00 zone.
A high was formed near $11.795 and the price is now consolidating gains near the 23.6% Fib retracement level of the upward move from the $9.28 swing low to the $11.95 high.
UNI is now trading above $11.20 and the 100-hourly simple moving average. Immediate resistance is near the $11.55 level. The next key resistance is near the $12.00 level. A close above the $12.00 level could open the doors for more gains in the near term.
The next key resistance could be near $12.20, above which the bulls are likely to aim a test of the $12.50 level. Any more gains might send UNI toward $13.50.
Are Dips Supported In Uniswap?
If UNI price fails to climb above $11.95 or $12.00, it could start a downside correction. The first major support is near the $11.00 level.
The next major support is near the $10.60 level or the 50% Fib retracement level of the upward move from the $9.28 swing low to the $11.95 high. A downside break below the $10.60 support might open the doors for a push toward $10.20.
Technical Indicators
Hourly MACD – The MACD for UNI/USD is gaining momentum in the bullish zone.
Hourly RSI (Relative Strength Index) – The RSI for UNI/USD is above the 50 level.
Major Support Levels – $11.00, $10.60, and $10.20.
Major Resistance Levels – $11.55, $12.00, and $12.20.


