VeChain Price Prediction – May 15
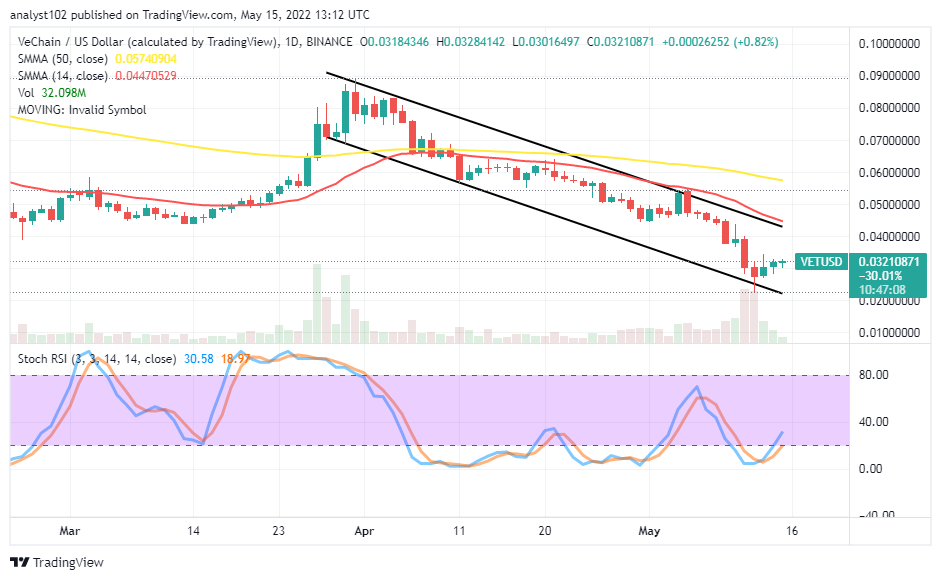
The recent general bearish motions in most of the crypto-economies have not left out the VET/USD market activities. Presently, VET trade worth has downed to touch the $0.02 support trading line. Price is maintaining a minute positive 0.82 percentage as it trades around the $0.032 value line.
VeChain (VET) Price Statistics:
VET price now – $0.032
VET market cap – $2.1 billion
VET circulating supply – 64.3 billion
VET total supply – 86.7 billion
Coinmarketcap ranking – #36
VeChain (VET) Market
Key Levels:
Resistance levels: $0.04, $0.05, $0.06
Support levels: $0.02, $0.01, $0.005 VET/USD – Daily Chart
The daily chart showcases VET has downed to touch the $0.02 support level on the May 12th trading session. Different sizes of bearish candlesticks have taken a formation denoting that the crypto’s price has been witnessing depression trading against the US Dollar valuation over time. The 14-day SMA indicator is underneath the 50-day SMA indicator. The bearish channel trend lines drew to ascertain the pace within which the market keeps to the downside. The Stochastic Oscillators have crossed northbound from the oversold region slightly against the range of 20.
Is it worthy of investing right now in the VET/USD market?
It is worthy of investing right now in the VET/USD market before the next rising force will occur. As the VET market price has downed to touch the $0.02 support level, a timely swinging motion followed it in no time to suggest the forces to the downside are getting weaker gradually. Therefore, it is expected of the long-position takers to be alert as to when a major upsurge will happen to key in fully back into the market operations.
On the downside of the technical analysis, the VET/USD market short-position takers have to follow the bearish trend back while the price tends to get rejected around the trend line of the 14-day SMA indicator. The main area of the resistant trading spot is a bit over the $0.04 level. A sudden fearful breakout of the value line will potentially lead to a change of direction in the succeeding trading days’ sessions. If that will be the case, then bears may be caged if the $0.04 resistance line turned out to be a support to getting swing-highs afterward.
VET/BTC Price Analysis
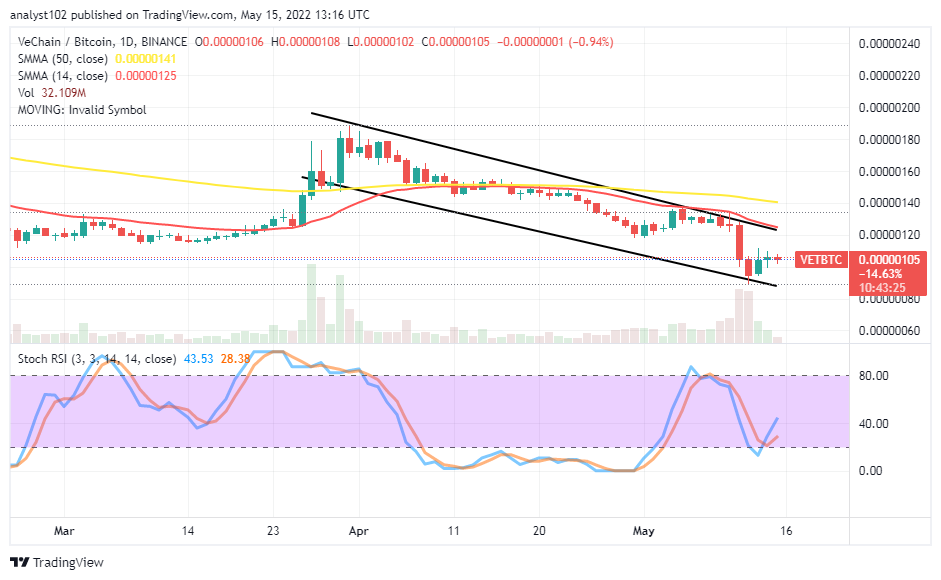
In comparison, VeChain’s trending ability outlook against Bitcoin has been under depression. The cryptocurrency pair market has downed to touch support around the lower bearish trend line. The 14-day SMA indicator is below the 50-day SMA indicator. The Stochastic Oscillators have moved southward within the ranges of 40 and 20. And they are seemingly trying to cross their lines northbound within those range values.
Looking to buy or trade VeChain now? Invest at eToro!
68% of retail investor accounts lose money when trading CFDs with this provider.
Read more:


