Veteran trader Peter Brandt believes that the recent rally of Bitcoin still isn’t enough to flip the long-term bearish trend. While BTC did have a brief surge, he insists it hasn’t reached the levels needed to confirm a bullish reversal.
Bitcoin needs to break $71,000 first and then confirm that, says Brandt. And while he claims this, other market analysts such as Jesse Colombo and Roman warn that geopolitical tensions and market patterns might bring BTC down even further.
QCP Capital highlights cautious optimism, noting that the recent sell-off appears shallow, suggesting potential for recovery. As more major traders take time to think about it, Michal van de Poppe thinks this pullback is short-term and would look forward to a retest of $60,000 support before Bitcoin makes a strong rebound.
For more than seven months now, Bitcoin has traded in a downtrend with consecutive lower highs and lower lows reinforcing bearish sentiment. Even though the short-lived optimism had some toe-hold moments, according to Brandt’s chart work, the larger pattern isn’t altered. BTC must break through the higher levels of resistance at hand before a shift to the bullish side can be seen.
Resistance Levels Holding Bitcoin Back
According to Brandt, Bitcoin is caught between two very important levels of resistance. The first is at $70,600, while the second and the all-time high of Bitcoin is at $73,800. Both marks have capped the upward movement repeatedly, and thus, they are a must for Bitcoin’s next major move. Since Bitcoin is unlikely to convincingly break above $71,000, the asset is likely going to stay in its current consolidation scenario, Brandt believes.
The recent rally in Bitcoin did NOT disturb the 7-month sequence of lower highs and lower lows. $BTC
Only a close above 71,000 confirmed by a new ATH will indicate that the trend from the Nov 2022 low remains in force pic.twitter.com/lFO9A20VPD— Peter Brandt (@PeterLBrandt) October 2, 2024
Roman is also one of the very popular crypto traders with a similar opinion. He noticed that any increases in volume along with price drops usually prove to confirm a strong downtrend. Roman believes that Bitcoin will test the $55,000-$57,000 range before any hope of reversal, which again puts emphasis on struggling to break through at those resistance levels.

Moving Averages And Market Uncertainty
Bitcoin’s 8-week simple moving average (SMA) has been residing at a level of around $60,526 and has served as resistance recently on the price charts. The price of BTC has hung off that line for a while, which indicates the fact that market participants haven’t really decided if they are buying or selling. It hasn’t traded too low below it to find good strength in order to move up either.
For volatility, the Average True Range of Bitcoin is at 5,756. That’s a relatively small level of volatility within the market. That only means the market can generate large moves, but hasn’t built an extreme level of volatility just yet. Dealers are watching closely for these indicators because they could signal where Bitcoin will break next.
Geopolitics Tensions And Market Sentiment
The Middle East tension is yet another strain in the cryptocurrency market. Of course, Bitcoin has started to surge in volatility alongside growing concerns of global instability. The price of Bitcoin over the last 24 hours has gone down by 3% to reach $61,380. Actually, that fall was part of the general sell-off among cryptocurrencies within which the entire market capitalization went down by 7.6% over two days.
Bitcoin and crypto always tank when there are geopolitical fears, unlike precious metals.
That confirms my long-held belief that crypto is not a safe-haven.
It’s yet another risk asset just like high-flying tech stocks. $BTC $GLD pic.twitter.com/SBLgLgdpKB
— Jesse Colombo (@TheBubbleBubble) October 1, 2024
According to Jesse Colombo, a well-known market analyst, Bitcoin, as well as other cryptocurrencies, usually worsen during periods of geopolitical instability. As he points out: “Bitcoin and crypto always tank when there are geopolitical fears, unlike precious metals.” The history was mainly the same with Bitcoin when global tensions reached their peak. It would appear the current market is no different from this historical precedent.
QCP Capital remains optimistic, despite the bearish sentiment that pours out from some corners. This is a token of positivity: sell-offs from a few days ago appear shallow, and one might expect investors to remain interested in risker assets, such as Bitcoin. Similarly, Michal van de Poppe predicts a retest of the $60,000 support level, suggesting the market could reverse course if that level holds.
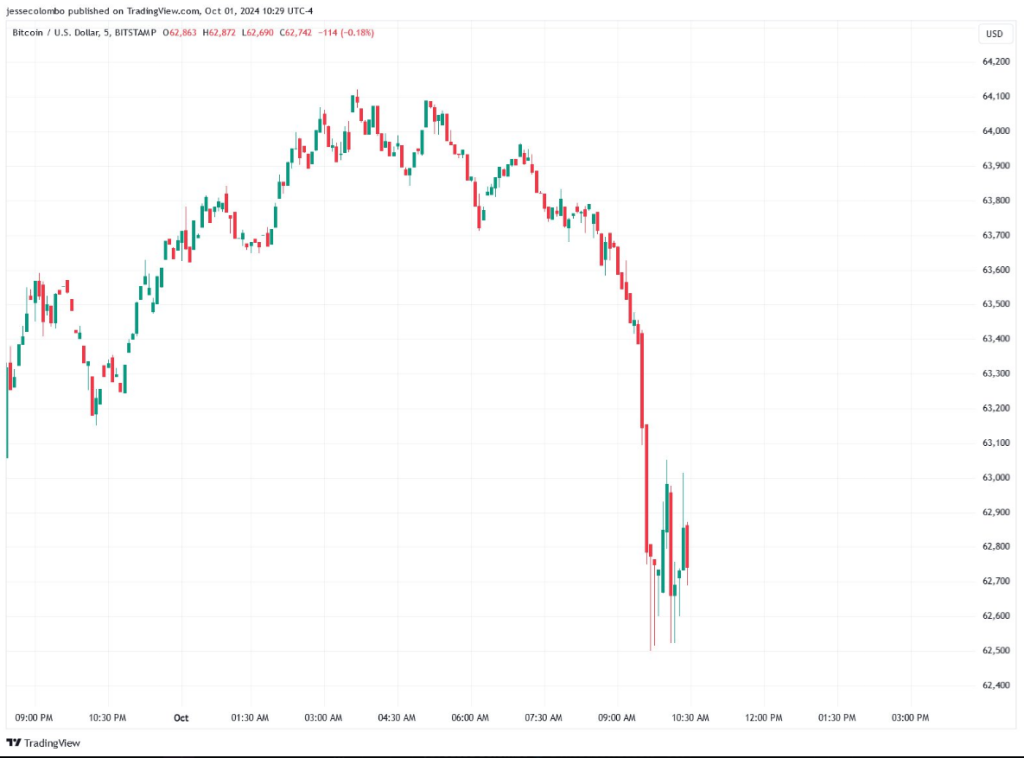
Featured image from Finshots, chart from TradingView


