The winds of change might be blowing for Polkadot (DOT), a popular blockchain network for connecting different blockchains. After a rough couple of months marked by a nearly 50% price decline from its April peak, DOT is exhibiting signs of a potential resurgence.
This positive outlook stems from a confluence of three key factors: whispers of a DOT-focused exchange-traded fund (ETF) on Coinbase, a bullish technical chart pattern, and healthy levels of liquidity in the market.
ETF Buzz Ignites Investor Interest
News broke earlier this week that crypto researcher 0xNoble revealed on a social media platform that Coinbase might be harboring secret plans for a DOT ETF. The rumor suggests the cryptocurrency exchange is in the initial stages of applying for the ETF, with the first approval hurdle anticipated on July 15th.
This news comes on the heels of Coinbase’s significant move on June 28th, where they filed applications for DOT Futures Contracts, a Futures ETF, and a Spot ETF.
Coinbase is secretly applying for $DOT ETF
The first stage of approval is already scheduled for July 15!
Polkadot ETF will be incredibly bullish for the entire ecosystem
pic.twitter.com/OF8CrJxp2m
— 0xNobler (@CryptoNobler) July 4, 2024


The prospect of a DOT ETF has generated excitement within the Polkadot community. Exchange-traded funds, which trade like stocks on traditional exchanges, can introduce a new wave of investors to the cryptocurrency space.
This broader exposure often translates to increased buying pressure and potentially higher prices for the underlying asset. Notably, the ETF announcement has already triggered a surge in activity on Coinbase Derivatives, a testament to the pent-up investor interest.

Polkadot: Technical Analysis Hints At Price Breakout
Adding fuel to the DOT rally fire is a recent technical analysis by ZAYK Charts, a well-respected cryptocurrency research firm. Their analysis of DOT’s one-day chart revealed a compelling pattern known as a falling wedge.
This pattern is characterized by converging trendlines that slope downwards, encapsulating lower highs and lower lows. While traditionally viewed as a bearish pattern, falling wedges can also indicate a potential bullish reversal.
According to ZAYK Charts, the falling wedge suggests that while sellers have been in control recently, their influence is waning. This is further evidenced by Polkadot oscillating within this pattern since February. The lower trendline has consistently provided support, while the upper trendline has acted as resistance.
ZAYK anticipates a breakout from this wedge, which typically leads to a significant upward price movement. Their breakout target sits around $9.60, representing a potential gain of over 50% from the current price level.
$DOT Still Moving Inside the Falling Wedge,In 1D Timeframe
Expecting Breakout
#DOT #DOTUSDT #Polkadot #Crypto pic.twitter.com/19eQ0cPBwR
— ZAYK Charts (@ZAYKCharts) July 7, 2024

The analyst highlights this target zone as a green box on the chart. The timing of this breakout is crucial – as DOT continues to trade within the narrowing wedge, pressure builds, making a breakout more likely in the near future.
Ample Liquidity Could Amplify Potential Surge
Adding another layer of intrigue to the DOT rally narrative is the presence of significant liquidity. A heatmap analysis by NewsBTC revealed concentrated liquidity zones for DOT between $6.45 and $6.96. Liquidity refers to the ease with which an asset can be bought or sold.
High liquidity translates to smoother price movements, as large buy or sell orders are less likely to cause significant price swings.
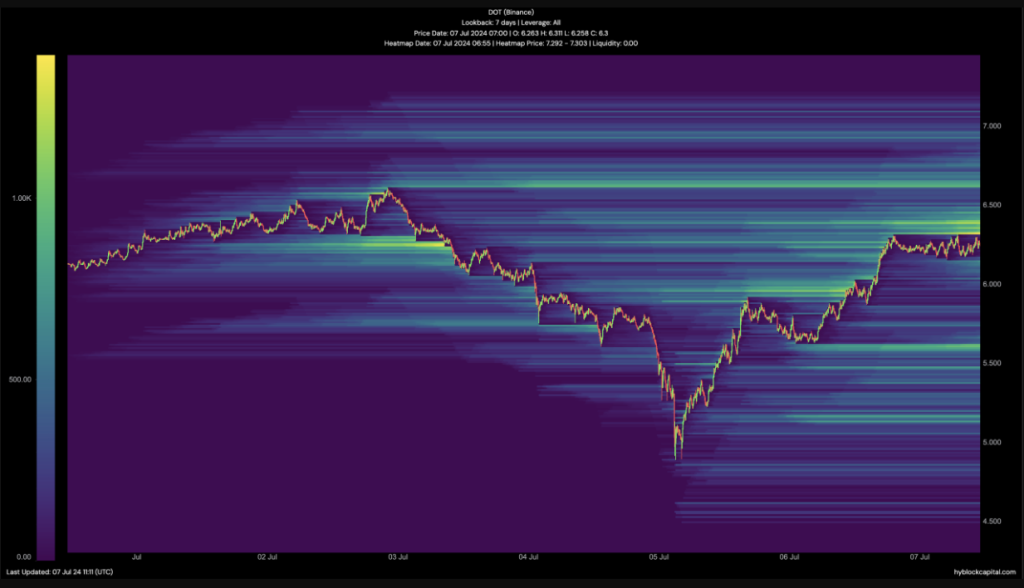
The presence of high liquidity between $6.45 and $6.96 creates a more favorable environment for a potential breakout. This abundance of buy and sell orders can act as a buffer, absorbing selling pressure and preventing sharp price drops.
If a breakout from the falling wedge occurs, this liquidity could help propel DOT’s price towards the $9.60 target zone identified by ZAYK Charts.
Featured image from Shutterstock, chart from TradingView


