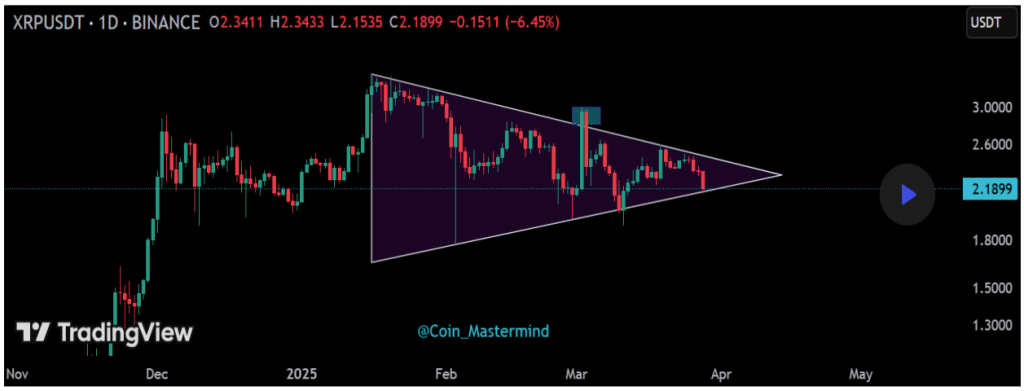
XRP has been on a consistent downward trend since the beginning of the just concluded week. A steady flow of consecutive bearish candles on the daily timeframe has pulled the price lower each day, eventually guiding it toward an important support at the time of writing.
As of now, XRP is pressing against the lower boundary of a symmetrical triangle, which could determine whether this dip becomes a deeper fall or the start of a rebound for the cryptocurrency.
Symmetrical Triangle Support In Focus
The symmetrical triangle on XRP’s daily chart is not a new pattern, but the way its price is currently interacting with its lower trendline is setting the stage for what could be a significant move. This interesting phenomenon was noted by a crypto analyst on the TradingView platform, who highlighted this technical zone as a critical decision point for XRP.
As shown in the chart below, the symmetrical triangle has been forming gradually since January, with the price oscillating between a sequence of lower highs and higher lows. This has led to a tightening range that hints at an impending breakout or breakdown.
The pattern’s base support line has been tested on three separate occasions over the past couple of months, each time resulting in a bounce upward. However, the persistence of retests also means the current retest might be broken easily.

Where Can XRP Go From Here?
If XRP manages to hold its ground at this support level and attract buying interest, a bounce could be on the cards. A successful rebound from this trendline might trigger a move toward the triangle’s upper boundary, which is acting as resistance.
Such a rally wouldn’t just keep the triangle intact, but it could also bring in bullish sentiment after four weeks of selling pressure. Still, the strength of any bounce will likely hinge on the accompanying trading volume. A bounce without a strong trading volume could result in a fake breakout.
However, the opposite scenario is just as likely. If XRP closes the daily candlestick below this support level, it would confirm a breakdown from the triangle structure, opening the door to further downside. As the analyst noted, “losing support may lead to further downside pressure.”
A breakdown would not only invalidate the consolidation structure but could also trigger stop-loss orders below support. Given the lack of immediate strong support beneath the current zone, XRP might face a strong decline to $2 if the support level fails to hold.
At the time of writing, XRP is trading at $2.18, having increased by 3.8% in the past 24 hours. Interestingly, the price dipped slightly below the lower boundary of the triangle earlier in the day. However, this move was quickly met with buying pressure, pushing the price action back into the triangle’s range. This small yet important action shows that bulls are still active at this level.
Featured image from Pexels, chart from TradingView


