The price of XRP has recorded a significant downtrend in the last 24 hours, declining by almost 5% according to data from CoinMarketCap. Amidst this price fall, renowned market analyst Ali Martinez has stated there is a strong bearish pattern forming on the XRP price chart signaling further price drops ahead.
XRP Faces Bearish Breakdown As Head-And-Shoulders Pattern Emerges
Over the last week, XRP investors have witnessed both sides of the crypto market volatility after a spontaneous 30% surge to $3.00 was followed by a bearish price action of almost equal strength. Currently, XRP trades at around $2.30 in a downtrend signaling a dominant selling pressure.
Commenting on the current state of the market, Ali Martinez stated that XRP’s price action on its daily chart is forming a head-and-shoulders pattern suggesting an incoming heavy price fall. For context, the head-and-shoulders pattern is a common reversal signal, that appears at the peak of an uptrend before a significant downtrend begins.
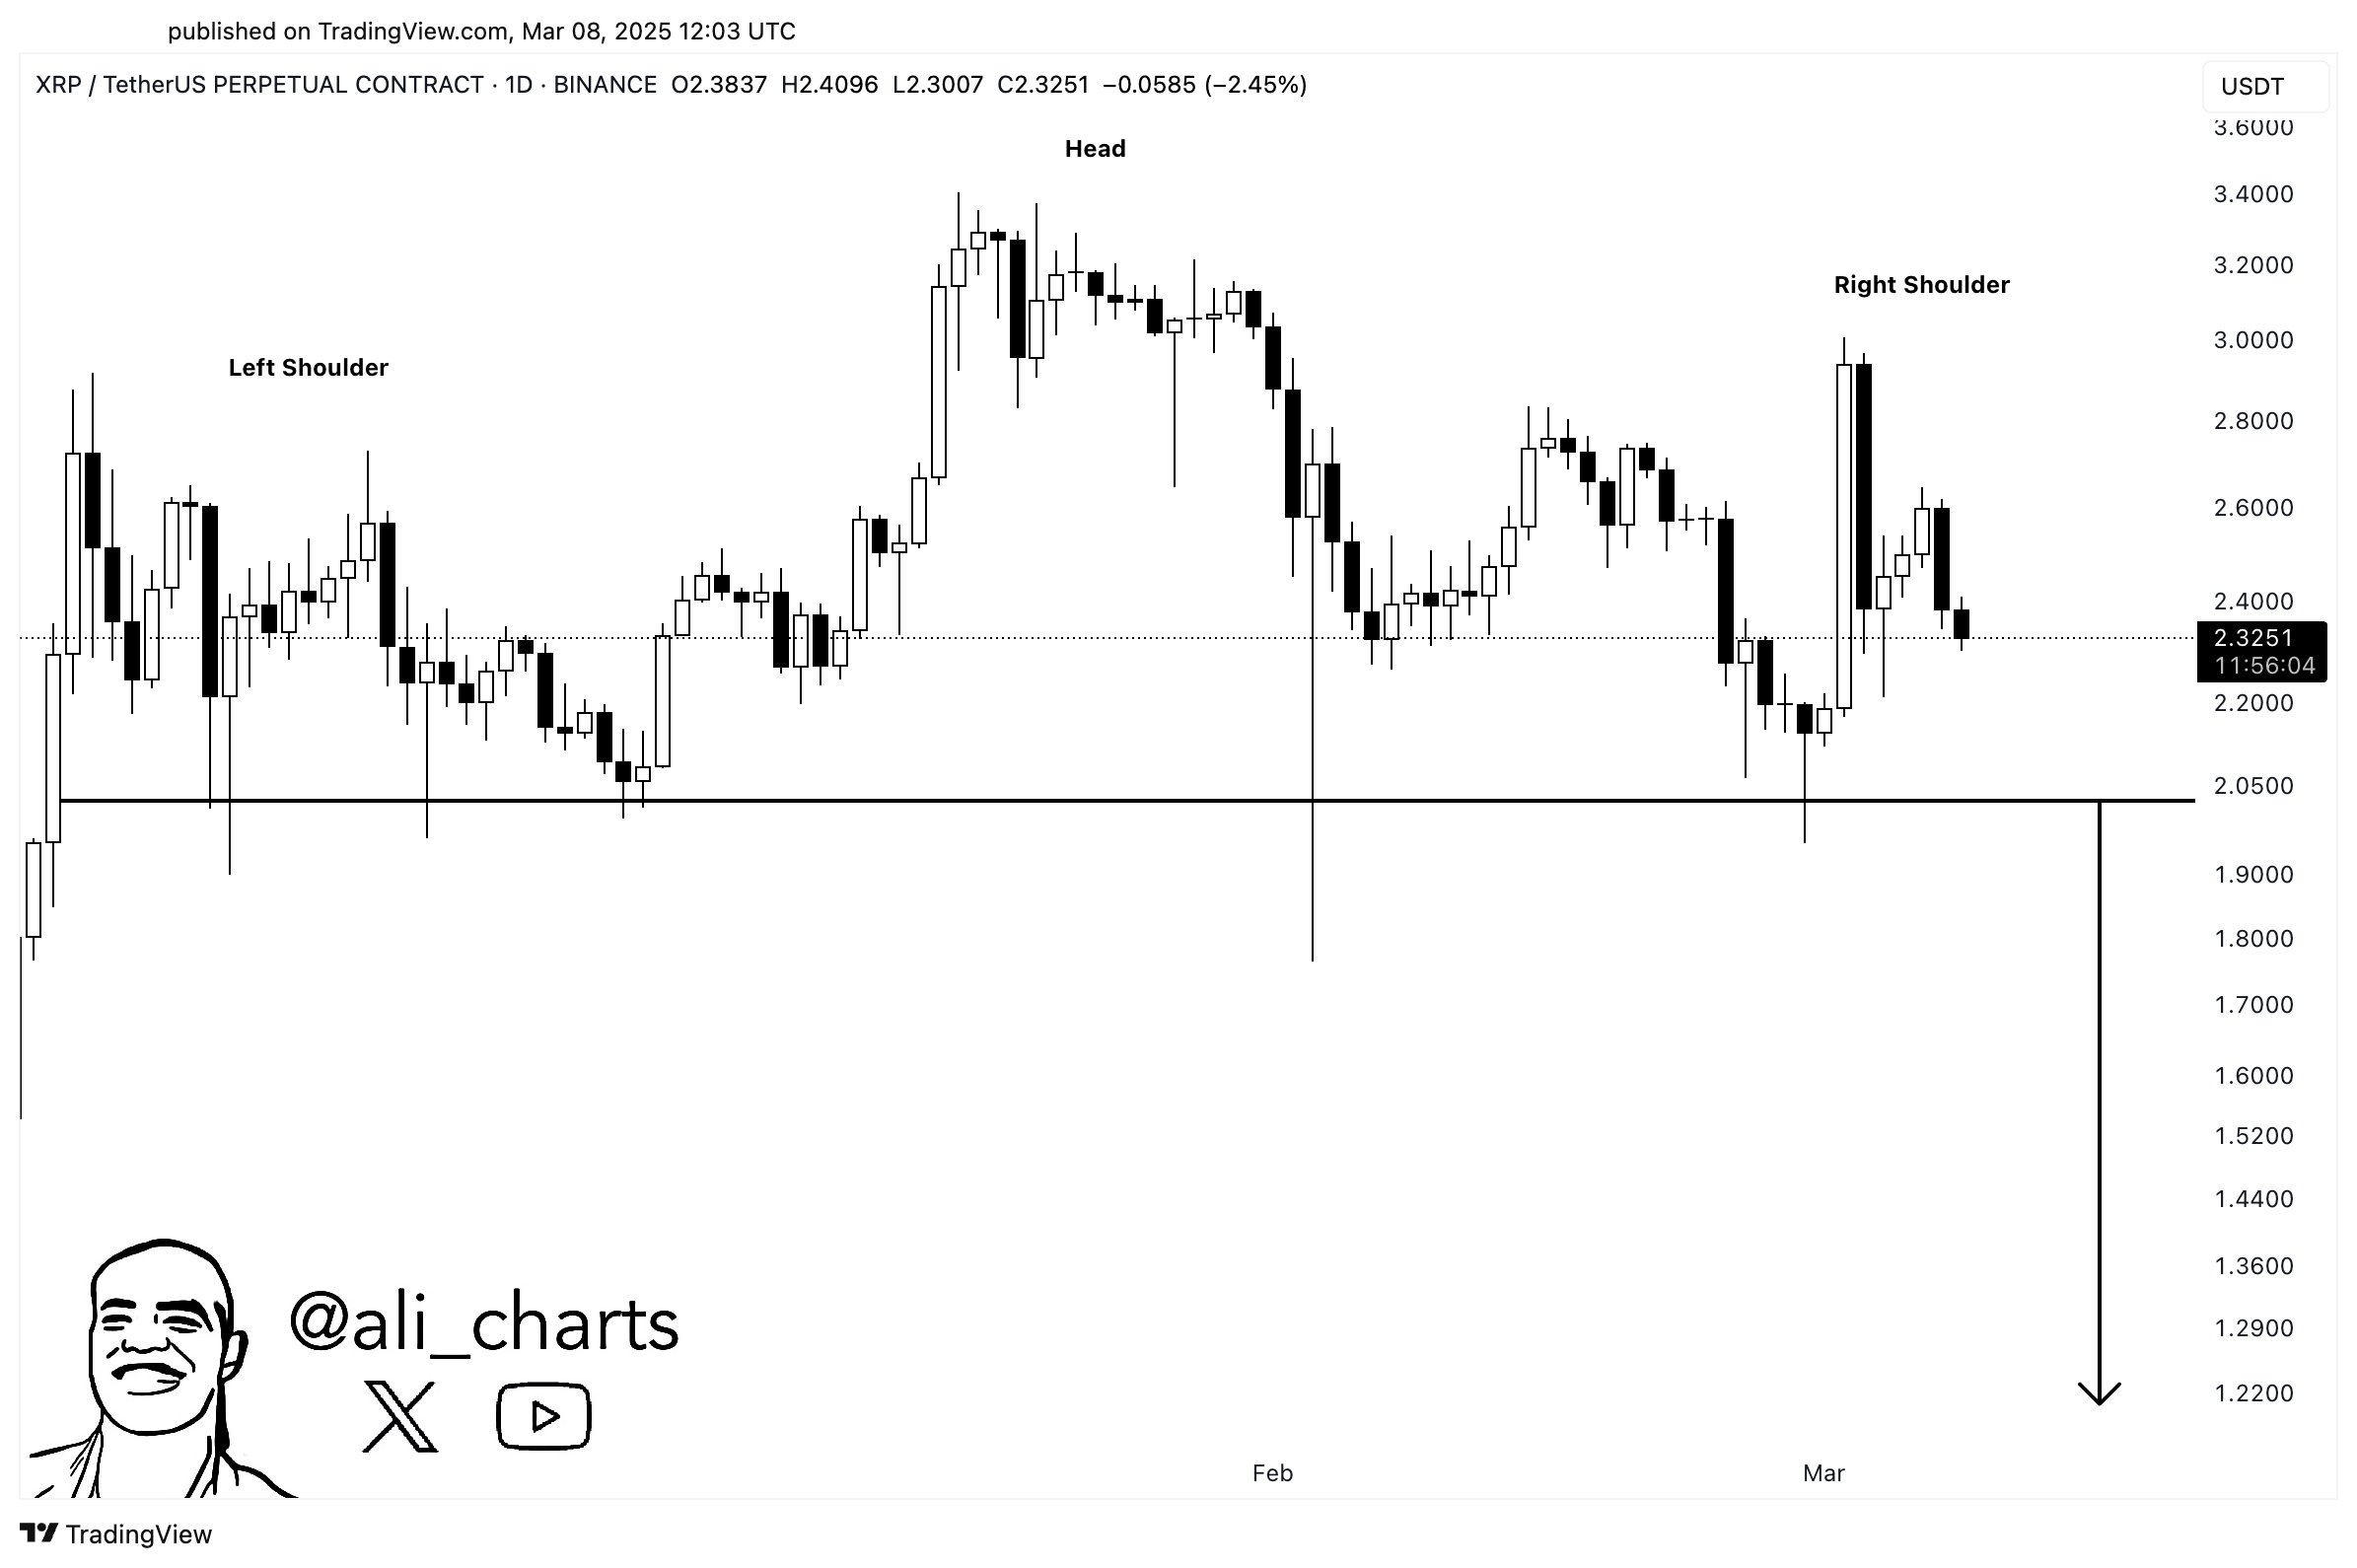
This bearish formation starts with the left shoulder which is an initial price peak followed by a moderate pullback. This can be seen with XRP’s price action in late 2024 after it surged to around $2.70 in early December before the general market correction. Thereafter, there is the head component which represents a higher price peak i.e. the current local market top at $3.40, followed by another decline.
Finally, the head and shoulders pattern is completed by the right shoulder formed by XRP’s choppy price action in the last week. The altcoin is now on a downtrend putting many traders on alert for a potential substantial price crash.
However, despite the head-and-shoulders pattern, a bearish signal can only be confirmed when XRP breaks decisively below the neckline at $2.20. In this case, Martinez warns the crypto asset could fall as low as $1.20, representing a potential 50% fall from XRP’s local highs seen in February.
In neutralizing this bearish projection, XRP bulls must provide enough market demand to push the coin past the right shoulder peak of $3.00, signaling momentum for a prolonged price uptrend.
XRP Market Overview
At press time, XRP trades at $2.34 following a 4.56% decline in the last 24 hours. However, its weekly chart reflects gains of 9.44% pushing the asset into minor monthly gains of 0.34%. The fourth largest cryptocurrency has recently dipped below its 100-day Simple Moving Average correlating with fears of a sustained price fall. However, the XRP community remains largely bullish according to CoinMarketCap data.
Related Reading: Bitcoin Price Forecast: LTF Head And Shoulders Pattern Predicts Crash – Here’s The Target


