XRP price again struggled to continue higher above the $0.5450 resistance. It is now moving lower and might test the $0.512 support zone.
- XRP is showing a few bearish signs from the $0.5420 zone.
- The price is now trading below $0.5350 and the 100-hourly Simple Moving Average.
- There was a break below a key contracting triangle with support at $0.5360 on the hourly chart of the XRP/USD pair (data source from Kraken).
- The pair could gain bearish momentum if it stays below the $0.5420 resistance zone.
XRP Price Faces Rejection
After a close above the $0.5320 level, XRP price extended its increase like Bitcoin and Ethereum. However, the bears were active near the $0.5420 resistance zone.
A high was formed at $0.5422 and the price started a downside correction. There was a move below the $0.5320 support zone and the 23.6% Fib retracement level of the upward move from the $0.5028 swing low to the $0.5422 high.
Besides, there was a break below a key contracting triangle with support at $0.5360 on the hourly chart of the XRP/USD pair. The pair is now trading below $0.5350 and the 100-hourly Simple Moving Average.
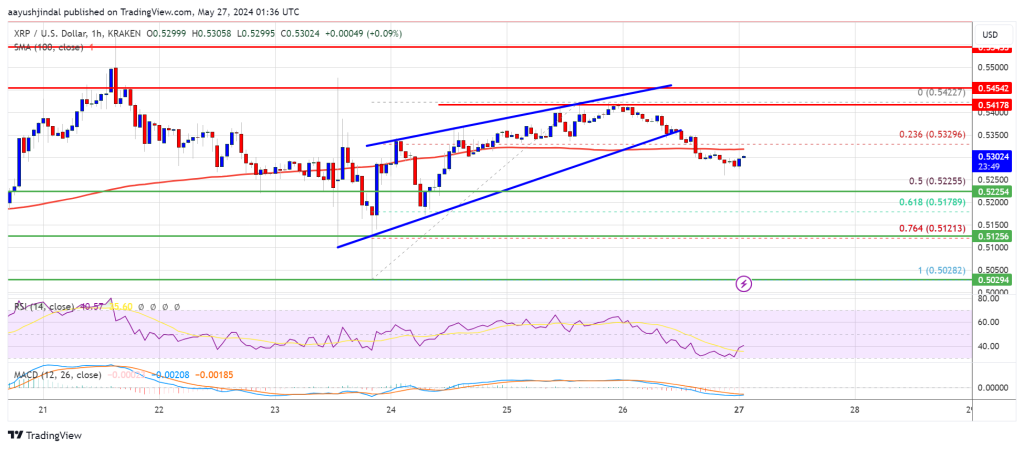
Immediate resistance is near the $0.5320 level. The first key resistance is near $0.5420. A close above the $0.5420 resistance zone could send the price higher. The next key resistance is near $0.5450. If the bulls push the price above the $0.5450 resistance level, there could be a steady increase toward the $0.5550 resistance. Any more gains might send the price toward the $0.5740 resistance.
More Losses?
If XRP fails to clear the $0.5420 resistance zone, it could start another decline within the range. Initial support on the downside is near the $0.5225 level and the 50% Fib retracement level of the upward move from the $0.5028 swing low to the $0.5422 high.
The next major support is at $0.5120. If there is a downside break and a close below the $0.5120 level, the price might gain bearish momentum. In the stated case, the price could decline and retest the $0.5025 support in the near term.
Technical Indicators
Hourly MACD – The MACD for XRP/USD is now gaining pace in the bearish zone.
Hourly RSI (Relative Strength Index) – The RSI for XRP/USD is now below the 50 level.
Major Support Levels – $0.5225 and $0.5120.
Major Resistance Levels – $0.5320 and $0.5420.


