XRP price extended its increase above the $0.550 resistance zone. The price is showing positive signs and might extend gains above $0.5850 and $0.600.
- XRP price started another increase above the $0.550 resistance zone.
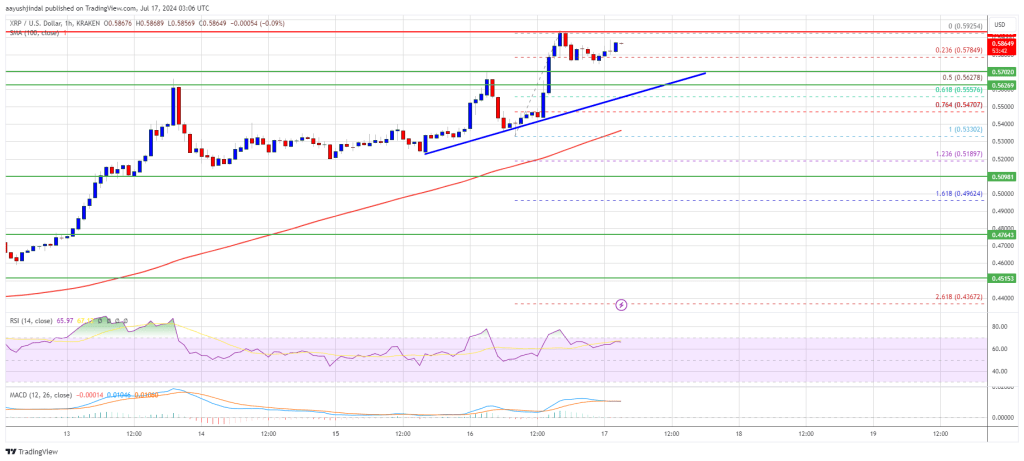
- The price is now trading above $0.550 and the 100-hourly Simple Moving Average.
- There is a connecting bullish trend line forming with support at $0.5620 on the hourly chart of the XRP/USD pair (data source from Kraken).
- The pair could extend gains if there is a close above the $0.600 resistance level.
XRP Price Regains Strength
XRP price formed a base above the $0.525 level and started a fresh increase. The price broke the $0.5450 resistance to move again into a positive zone like Ethereum and Bitcoin.
There was also a move above the $0.5650 resistance level. A high was formed at $0.5925 and the price is now consolidating gains. There was a minor decline below the 23.6% Fib retracement level of the upward move from the $0.5330 swing low to the $0.5925 high.
The price is now trading above $0.5550 and the 100-hourly Simple Moving Average. Besides, there is a connecting bullish trend line forming with support at $0.5620 on the hourly chart of the XRP/USD pair.
On the upside, the price is facing resistance near the $0.5950 level. The first major resistance is near the $0.600 level. The next key resistance could be $0.620. A clear move above the $0.620 resistance might send the price toward the $0.6380 resistance. The next major resistance is near the $0.650 level. Any more gains might send the price toward the $0.6880 resistance.
Are Dips Supported?
If XRP fails to clear the $0.600 resistance zone, it could start a downside correction. Initial support on the downside is near the $0.5620 level, the trend line, and the 50% Fib retracement level of the upward move from the $0.5330 swing low to the $0.5925 high.
The next major support is at $0.550. If there is a downside break and a close below the $0.550 level, the price might continue to decline toward the $0.5350 support in the near term.
Technical Indicators
Hourly MACD – The MACD for XRP/USD is now gaining pace in the bullish zone.
Hourly RSI (Relative Strength Index) – The RSI for XRP/USD is now above the 50 level.
Major Support Levels – $0.5620 and $0.5500.
Major Resistance Levels – $0.5950 and $0.6000.


